Effective Plotting
Scatter and Line Plots
Brett Andrews
10.30.2018
Don't make me think!
Take advantage of human perception.
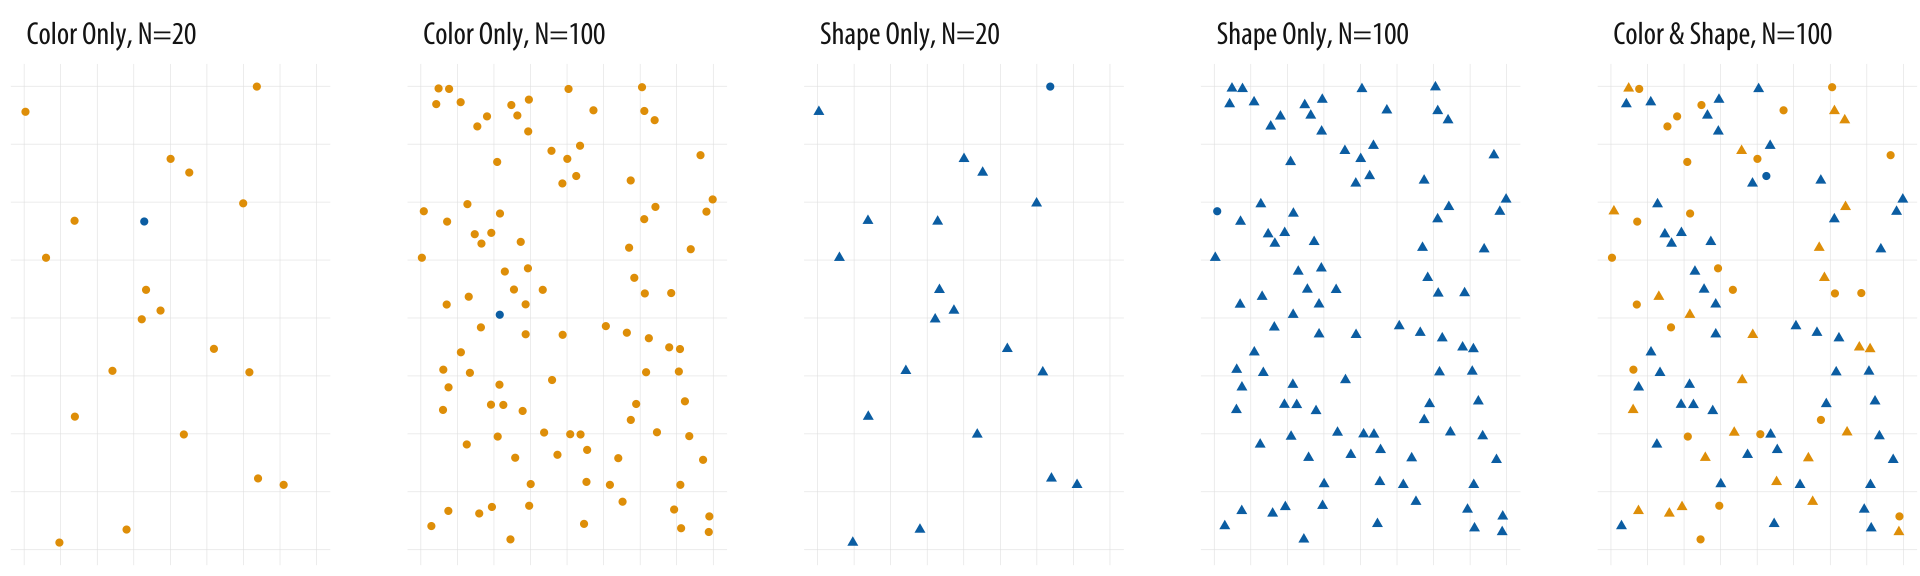
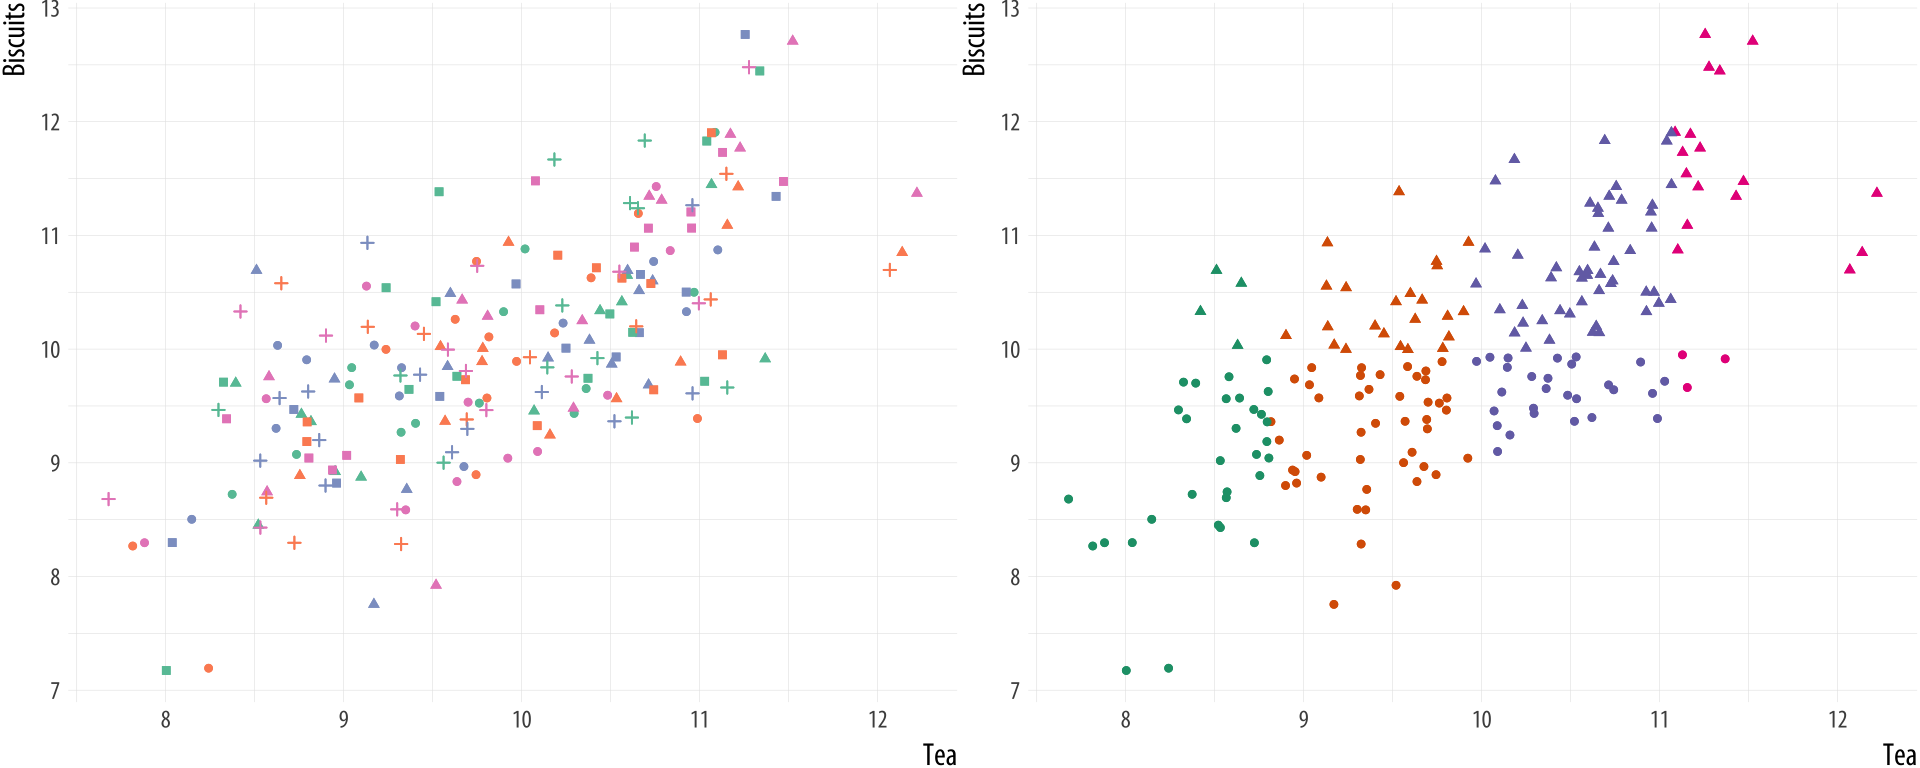
Color better than shape.
Kieran Healy, "Data Vizualization: a Practical Introduction."
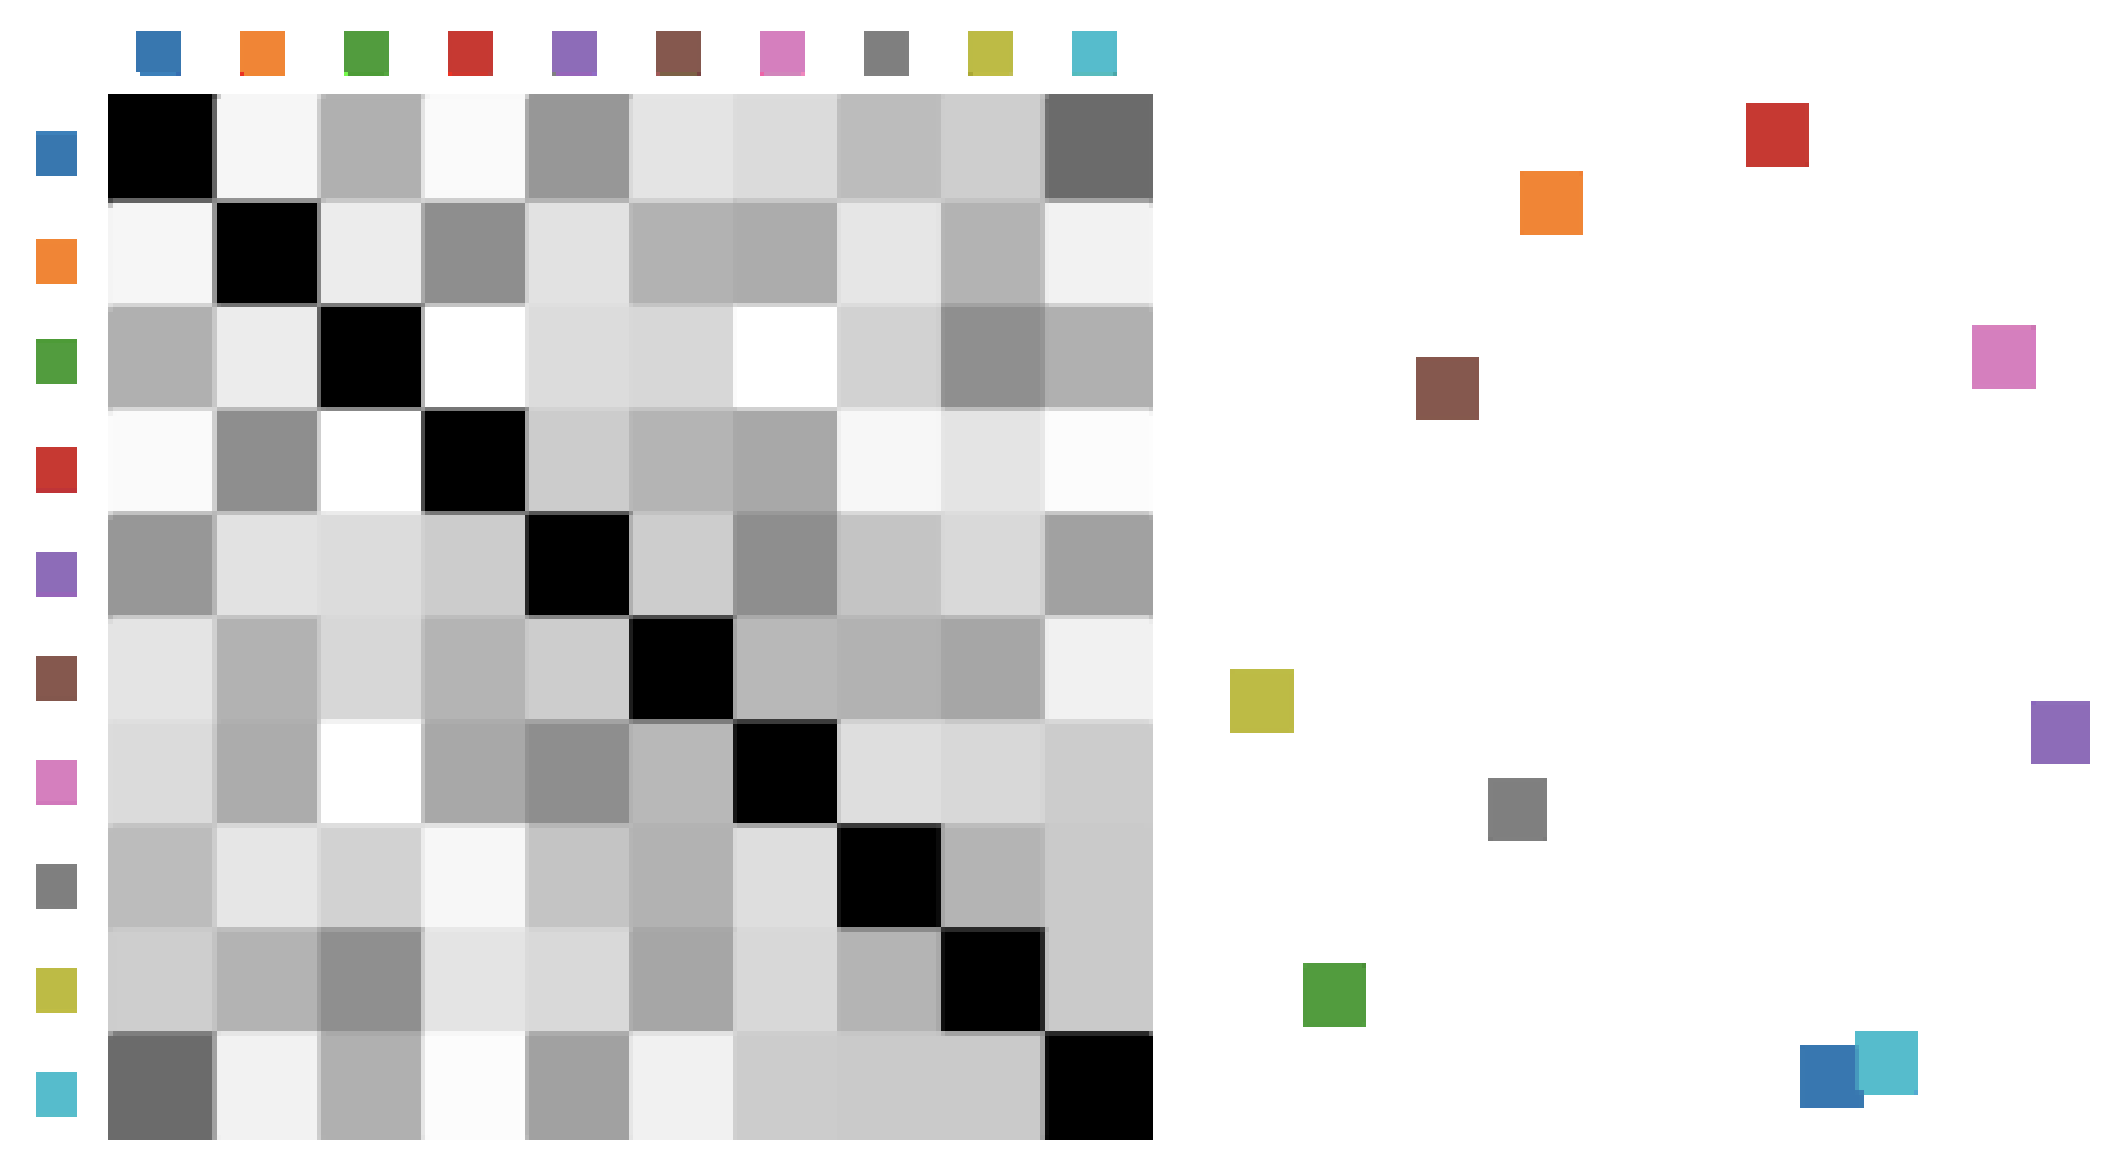
Which colors play nicely together?
Demiralp et al. (2014), "Learning Perceptual Kernels for Vizualization Design."
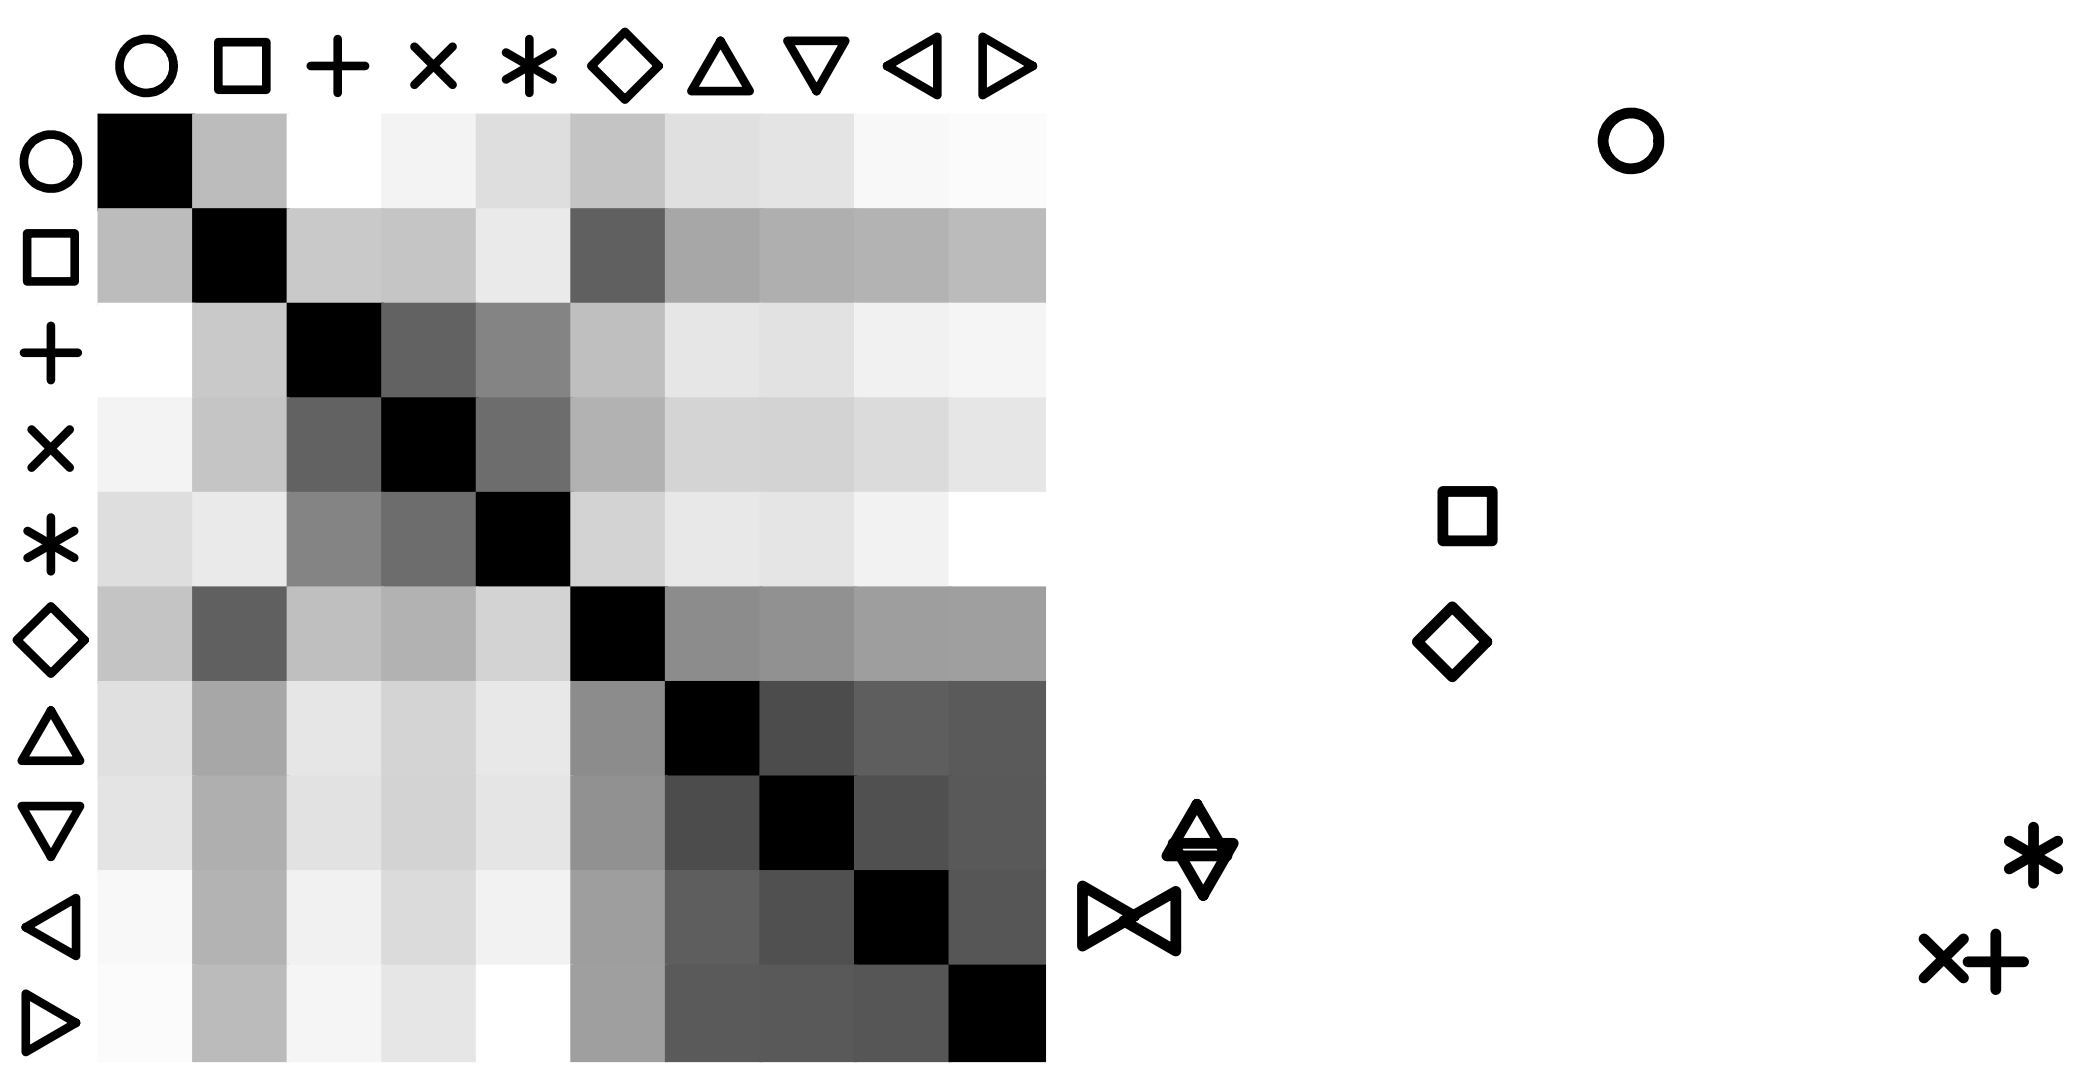
Which shapes play nicely together?
Demiralp et al. (2014), "Learning Perceptual Kernels for Vizualization Design."
Distinguishability falls off a cliff unless data is highly structured.
Kieran Healy, "Data Vizualization: a Practical Introduction."
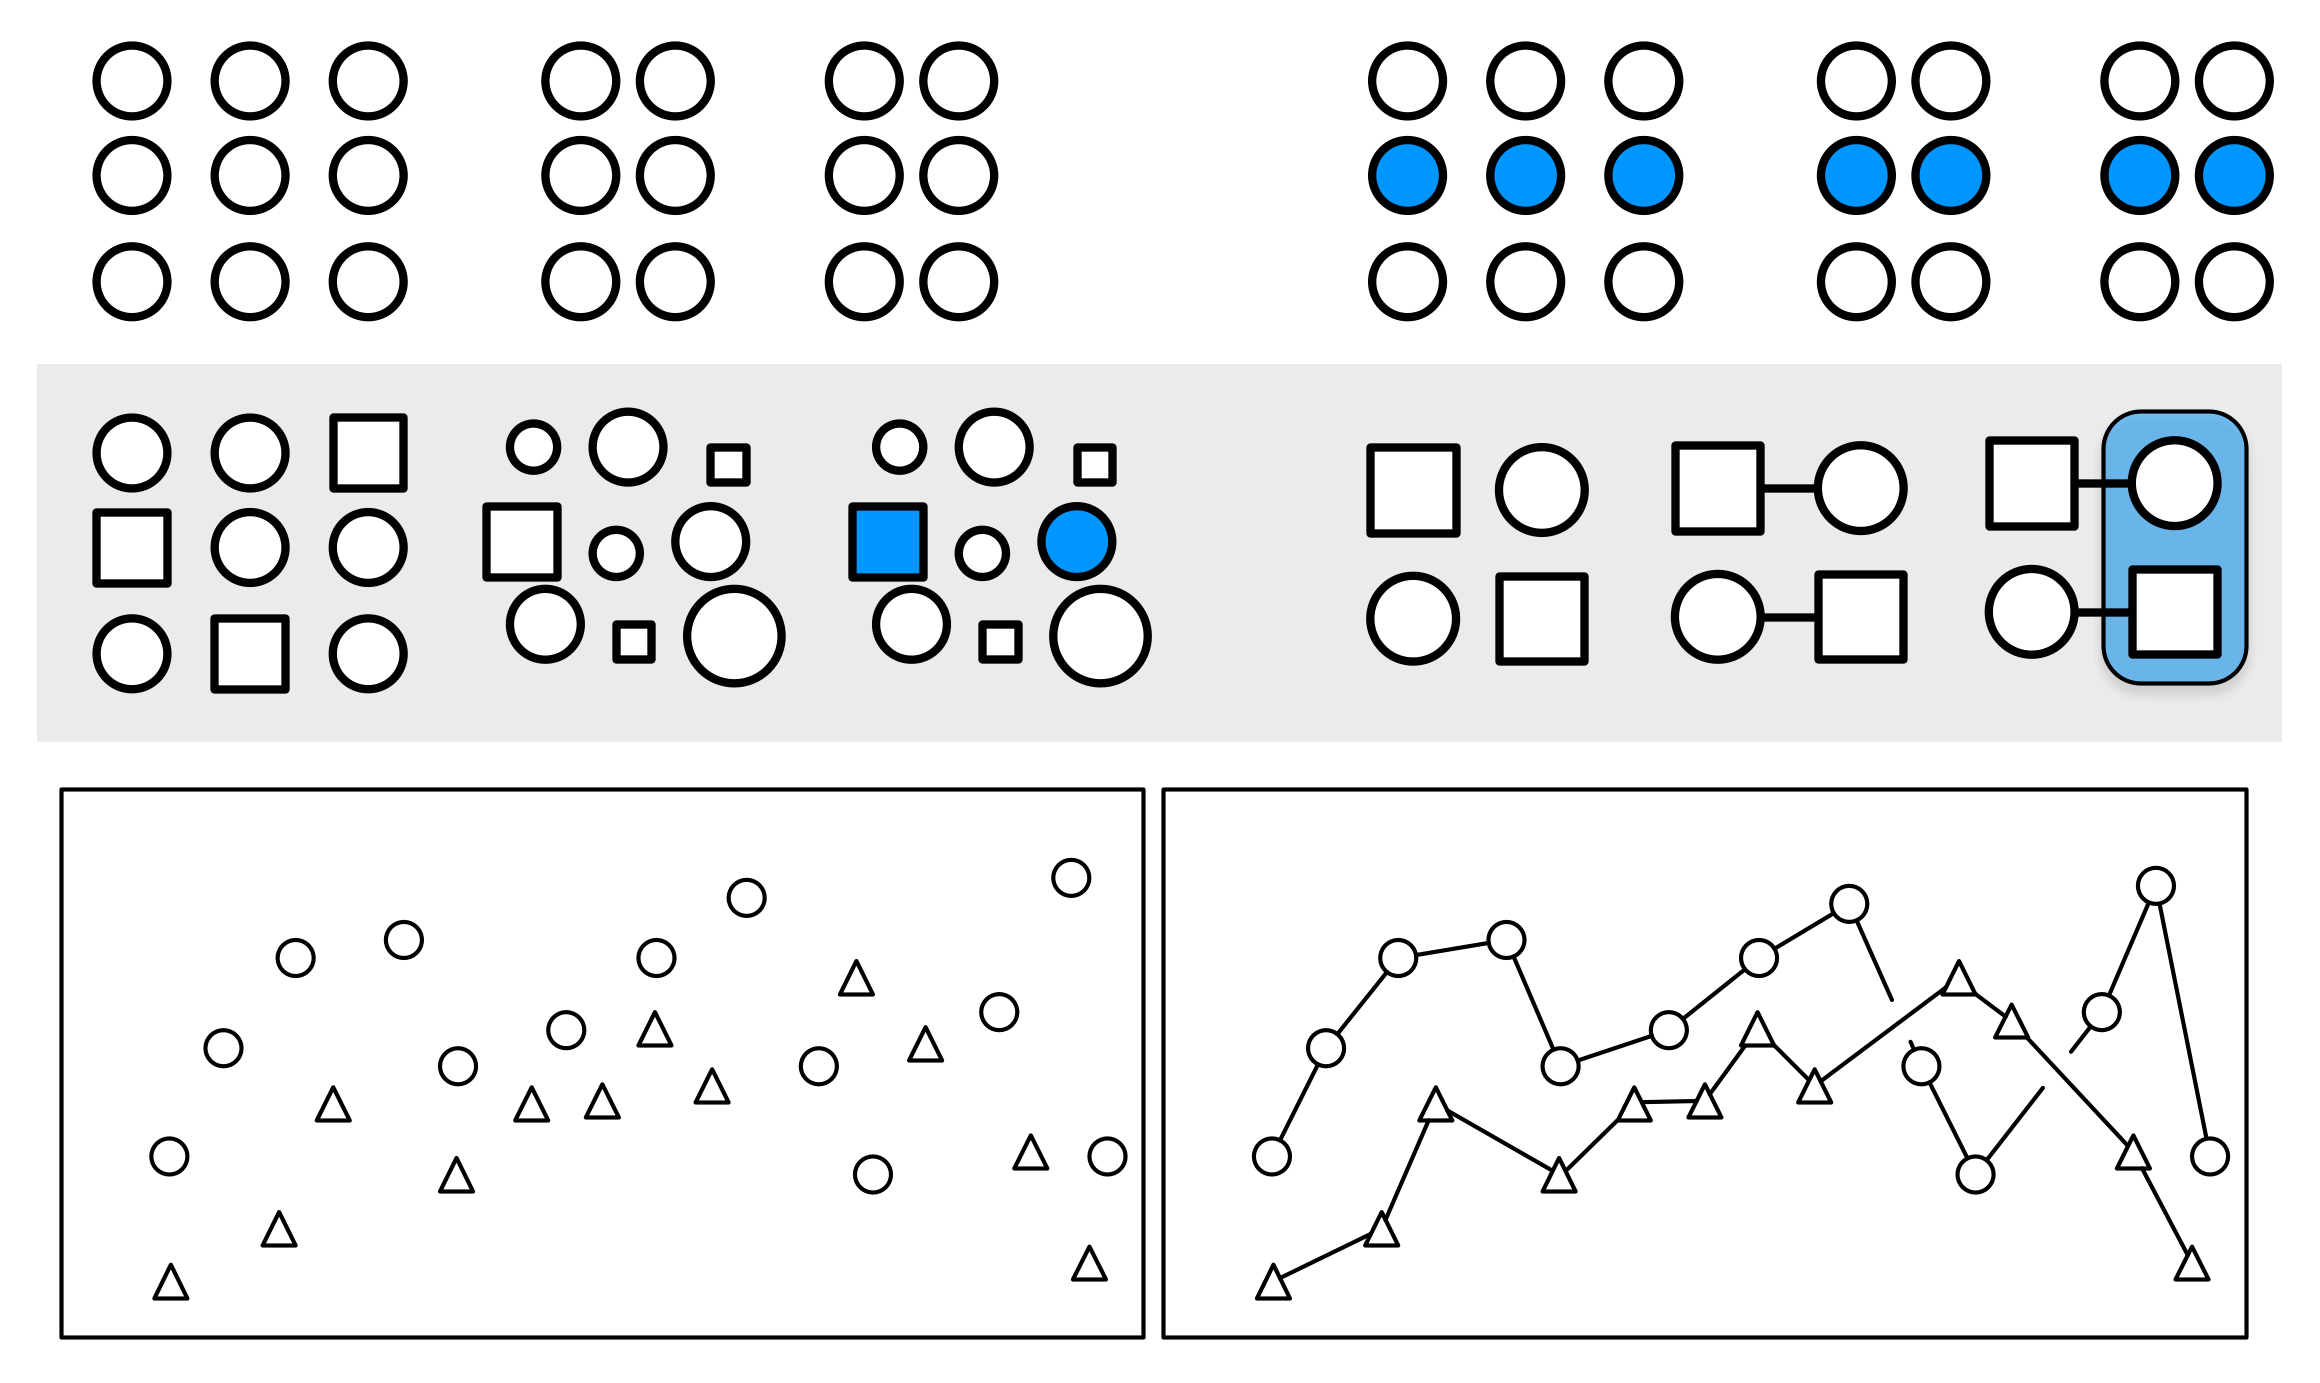
- Proximity: Things that are spatially near to one another seem to be related.
- Similarity: Things that look alike seem to be related.
- Connection: Things that are visually tied to one another seem to be related.
- Continuity: Partially hidden objects are completed into familiar shapes.
- Closure: Incomplete shapes are perceived as complete.
- Figure and Ground: Visual elements are taken to be either in the foreground or the background.
- Common Fate: Elements sharing a direction of movement are perceived as a unit.
Kieran Healy, "Data Vizualization: a Practical Introduction."
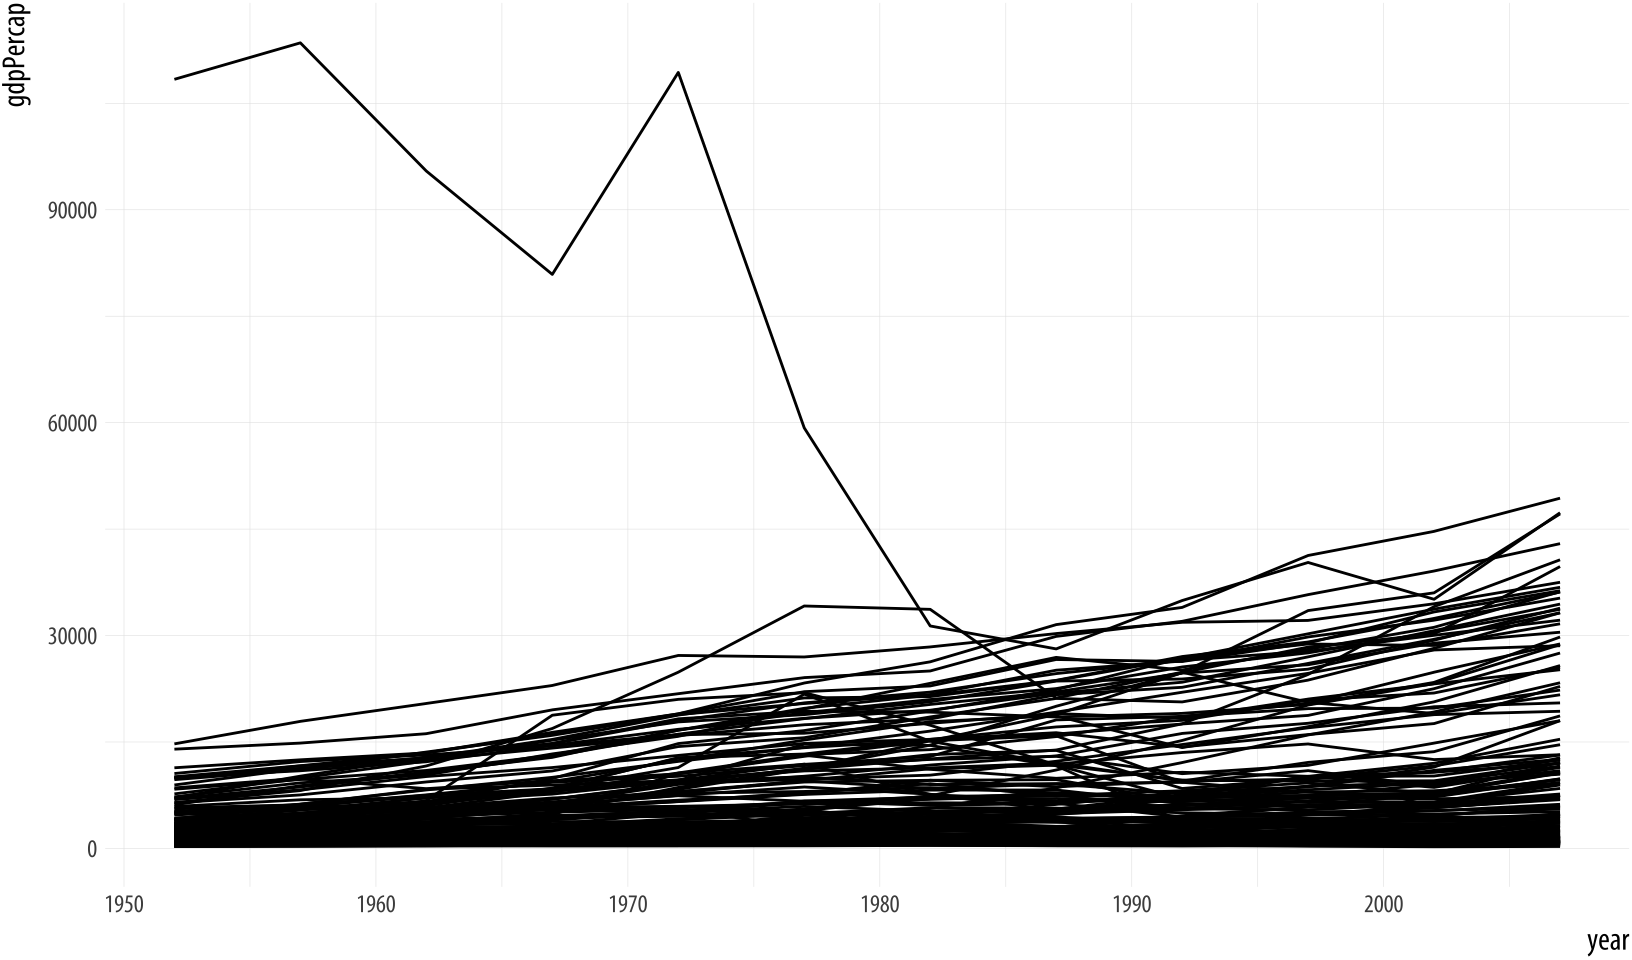
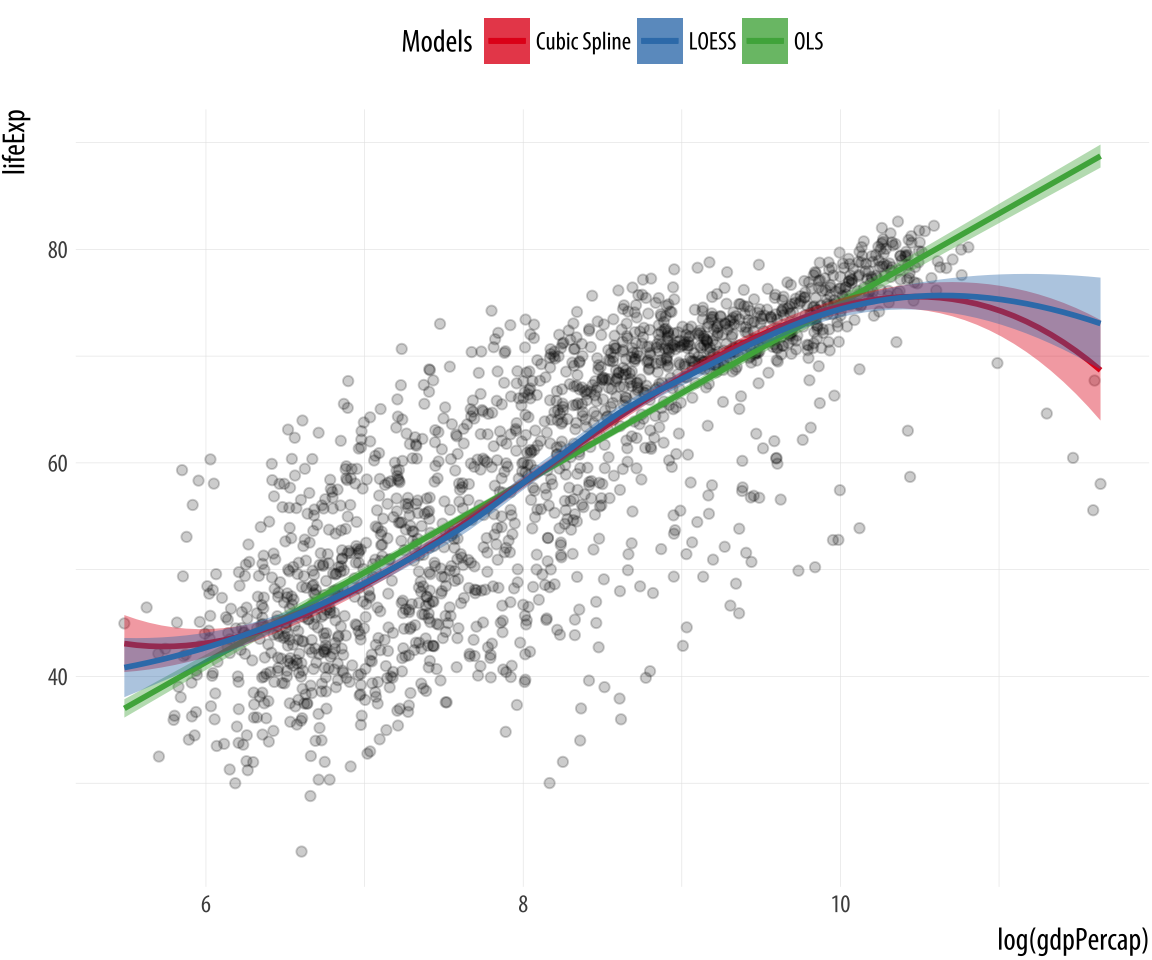
Don't need to show all data in one panel.
Kieran Healy, "Data Vizualization: a Practical Introduction."
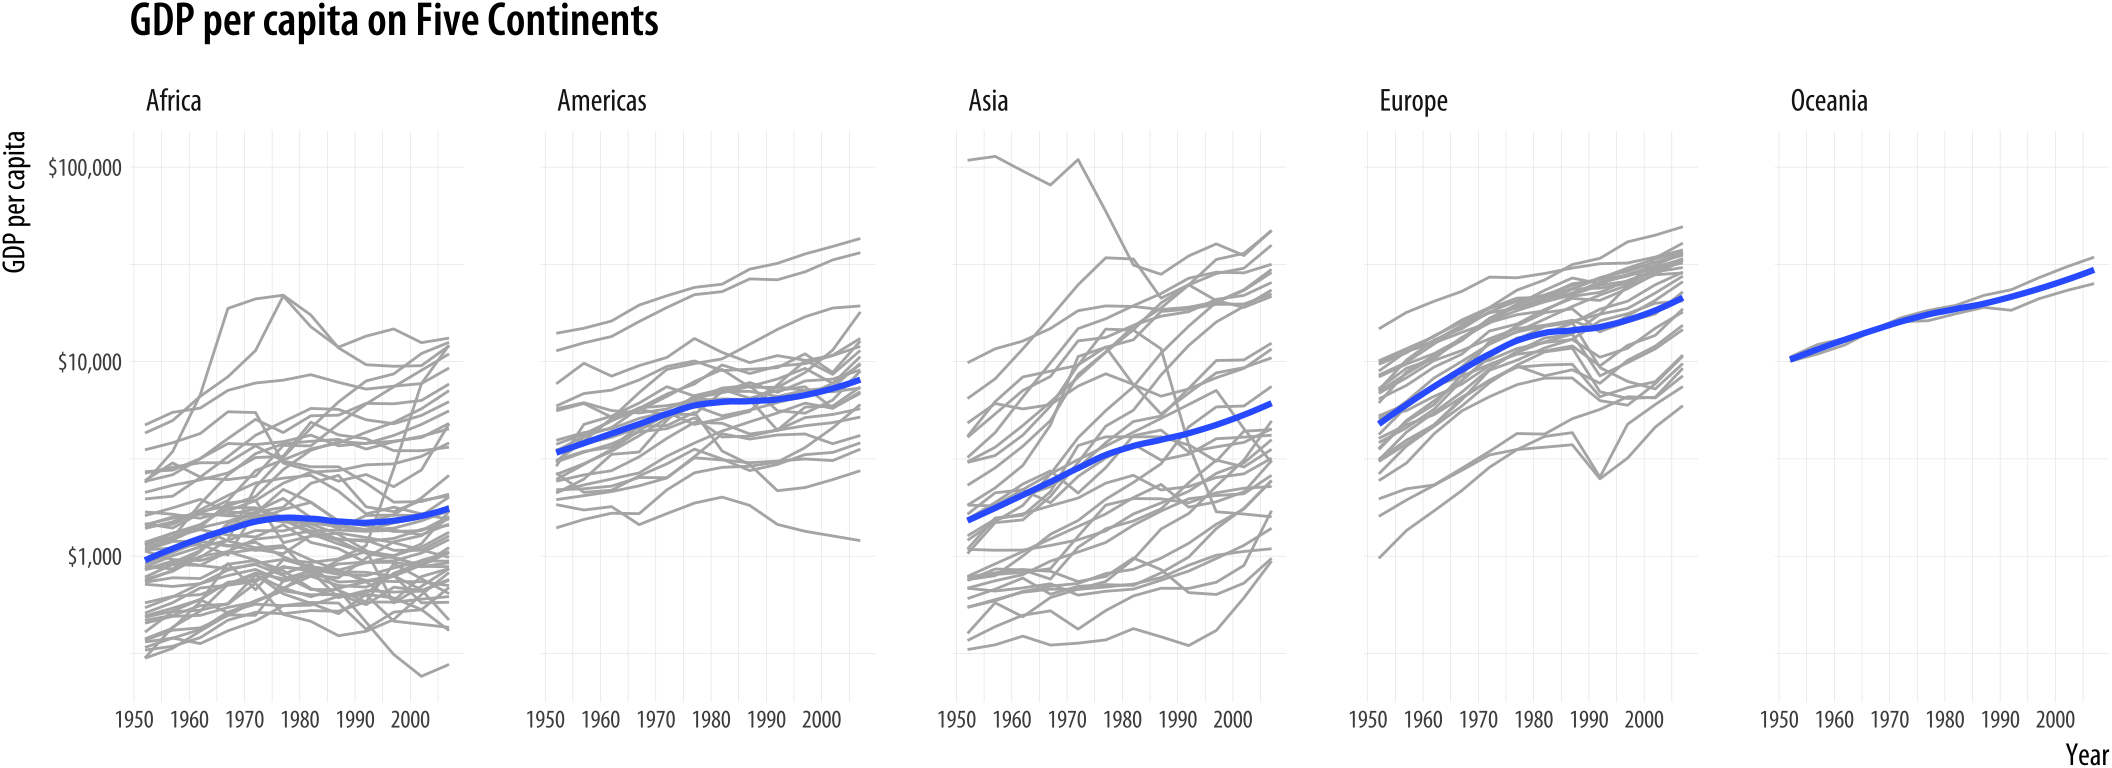
Multiple panels add structure.
Kieran Healy, "Data Vizualization: a Practical Introduction."
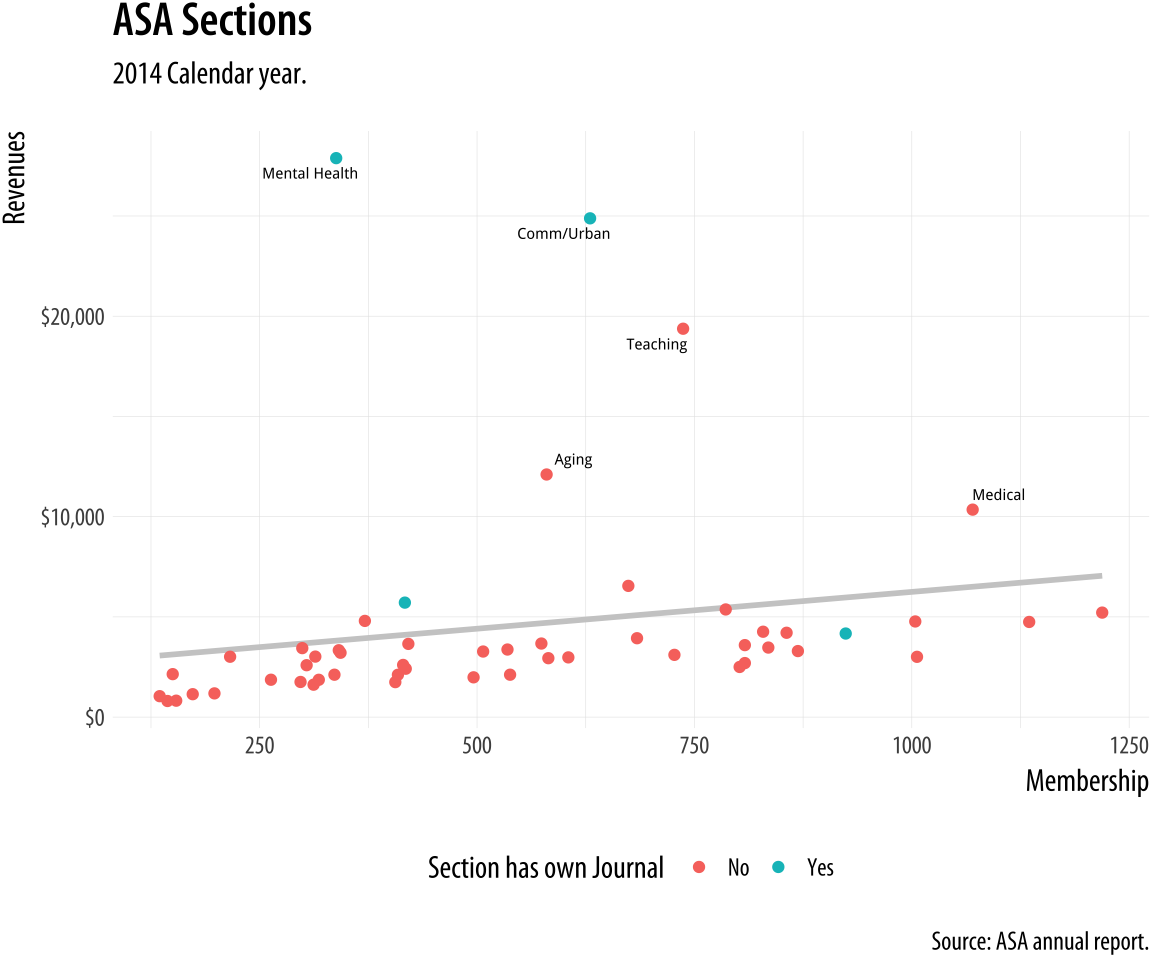
Annotate outliers.
Kieran Healy, "Data Vizualization: a Practical Introduction."
Alpha for overlapping points.
Kieran Healy, "Data Vizualization: a Practical Introduction."
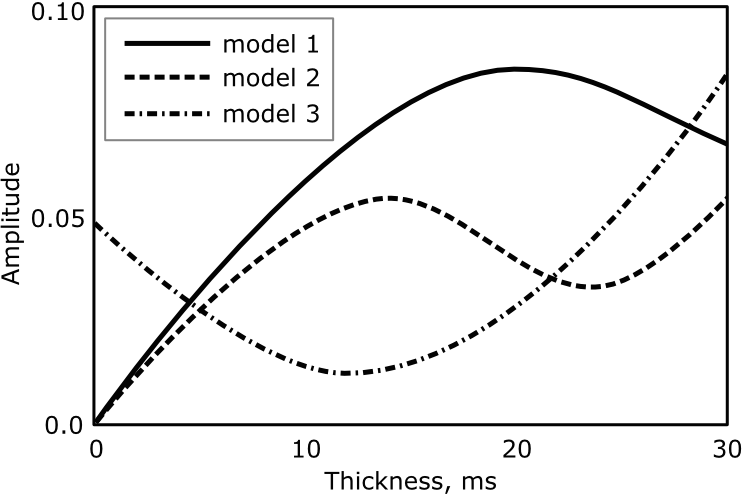
Basic Legend.
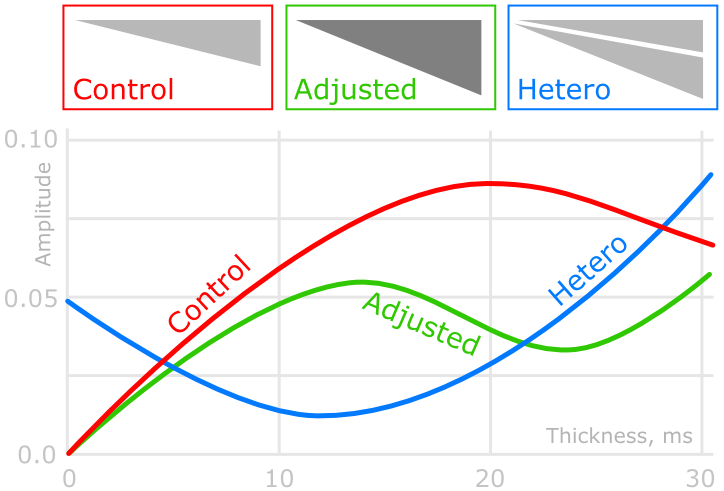
More intuitive.
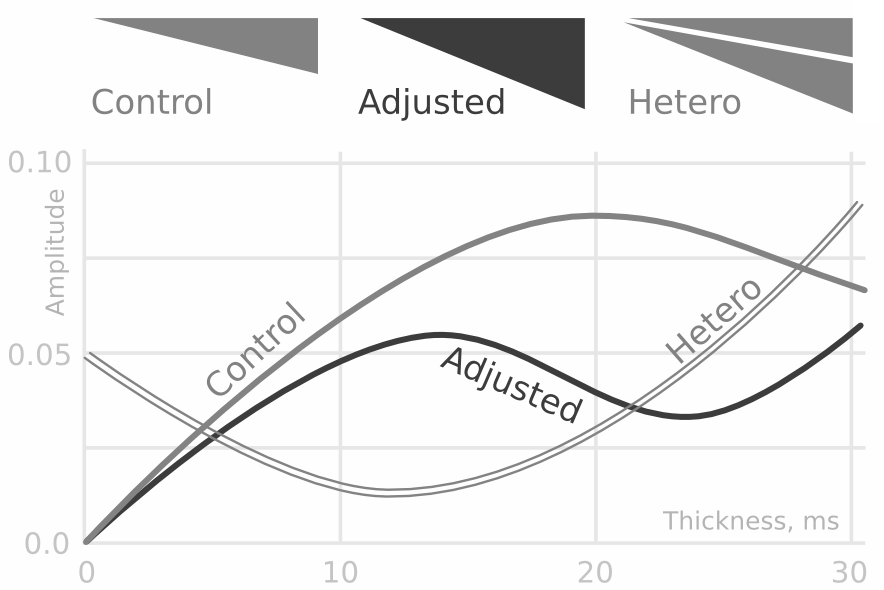
Black and white option.
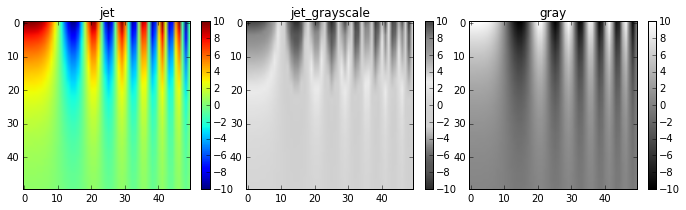
Don't use jet.
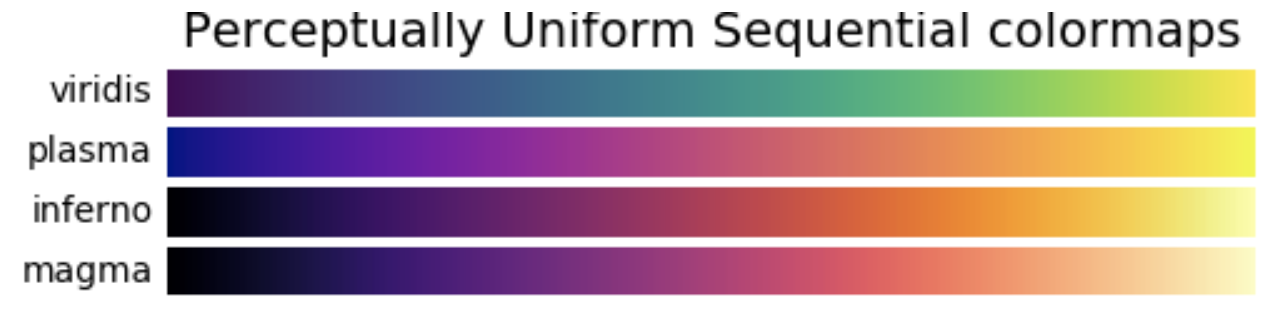
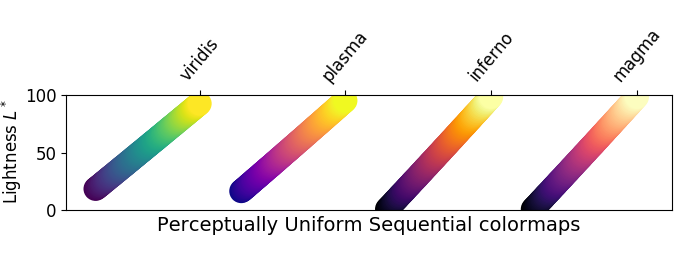
Sequential Colormaps
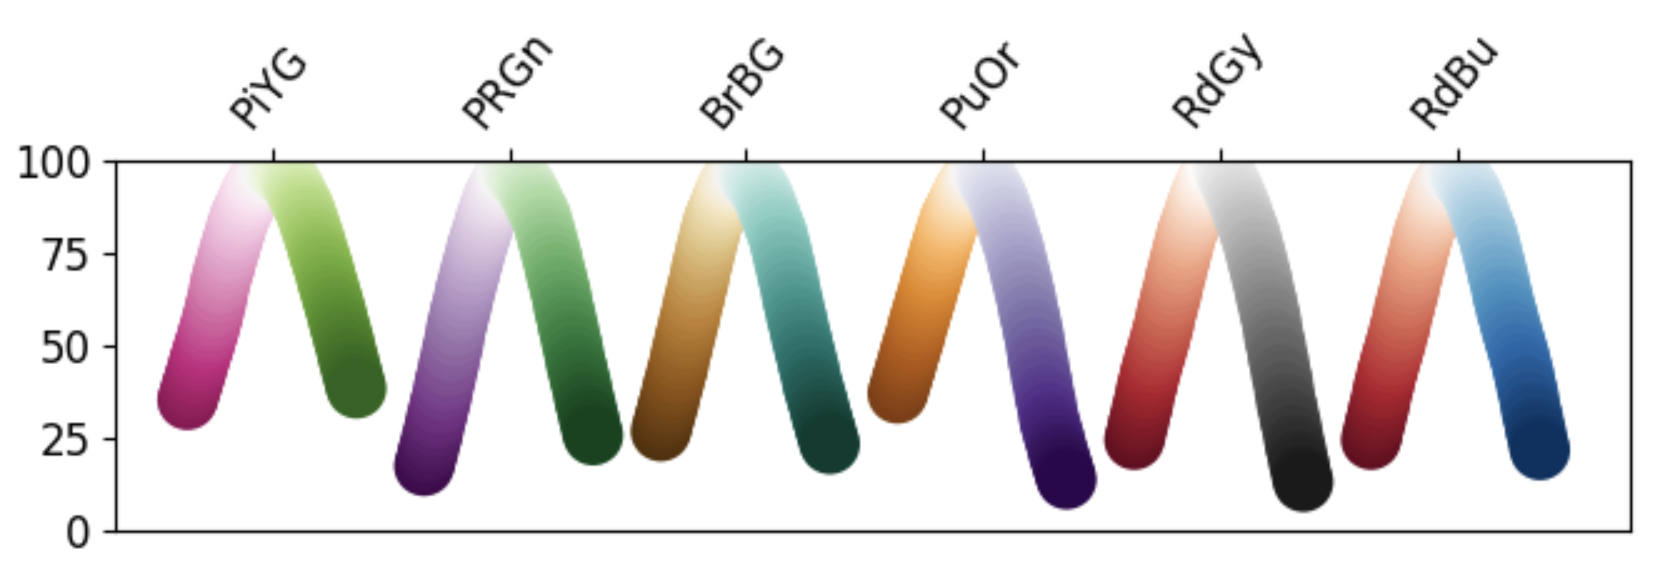
Diverging Colormaps
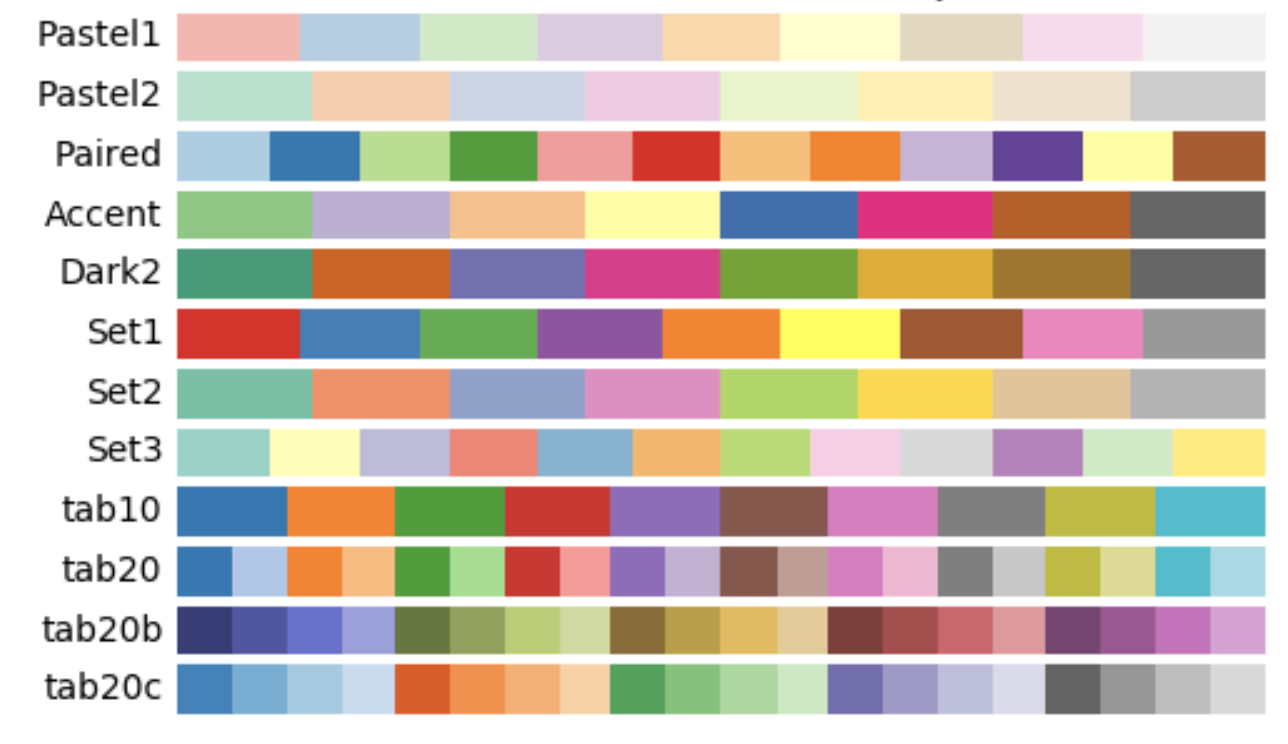
Qualitative Colormaps
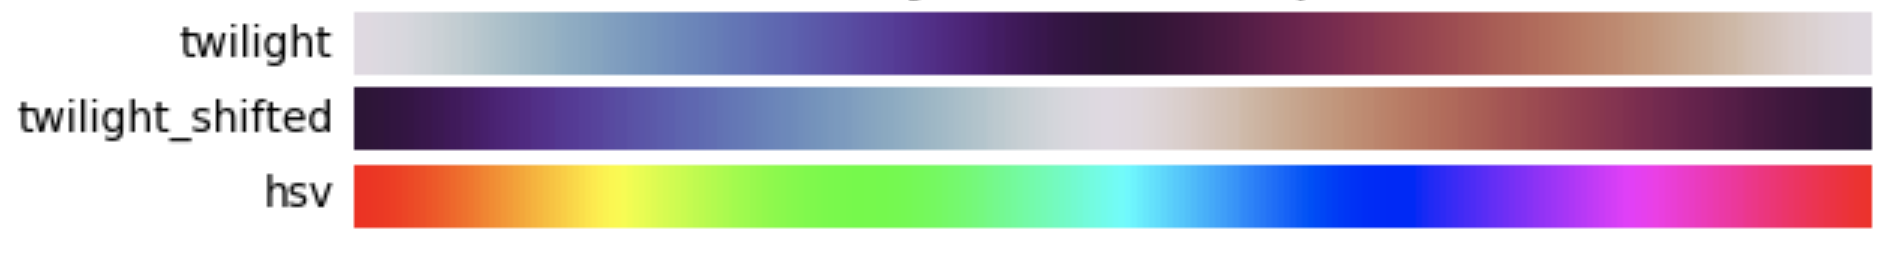
Cyclic Colormaps
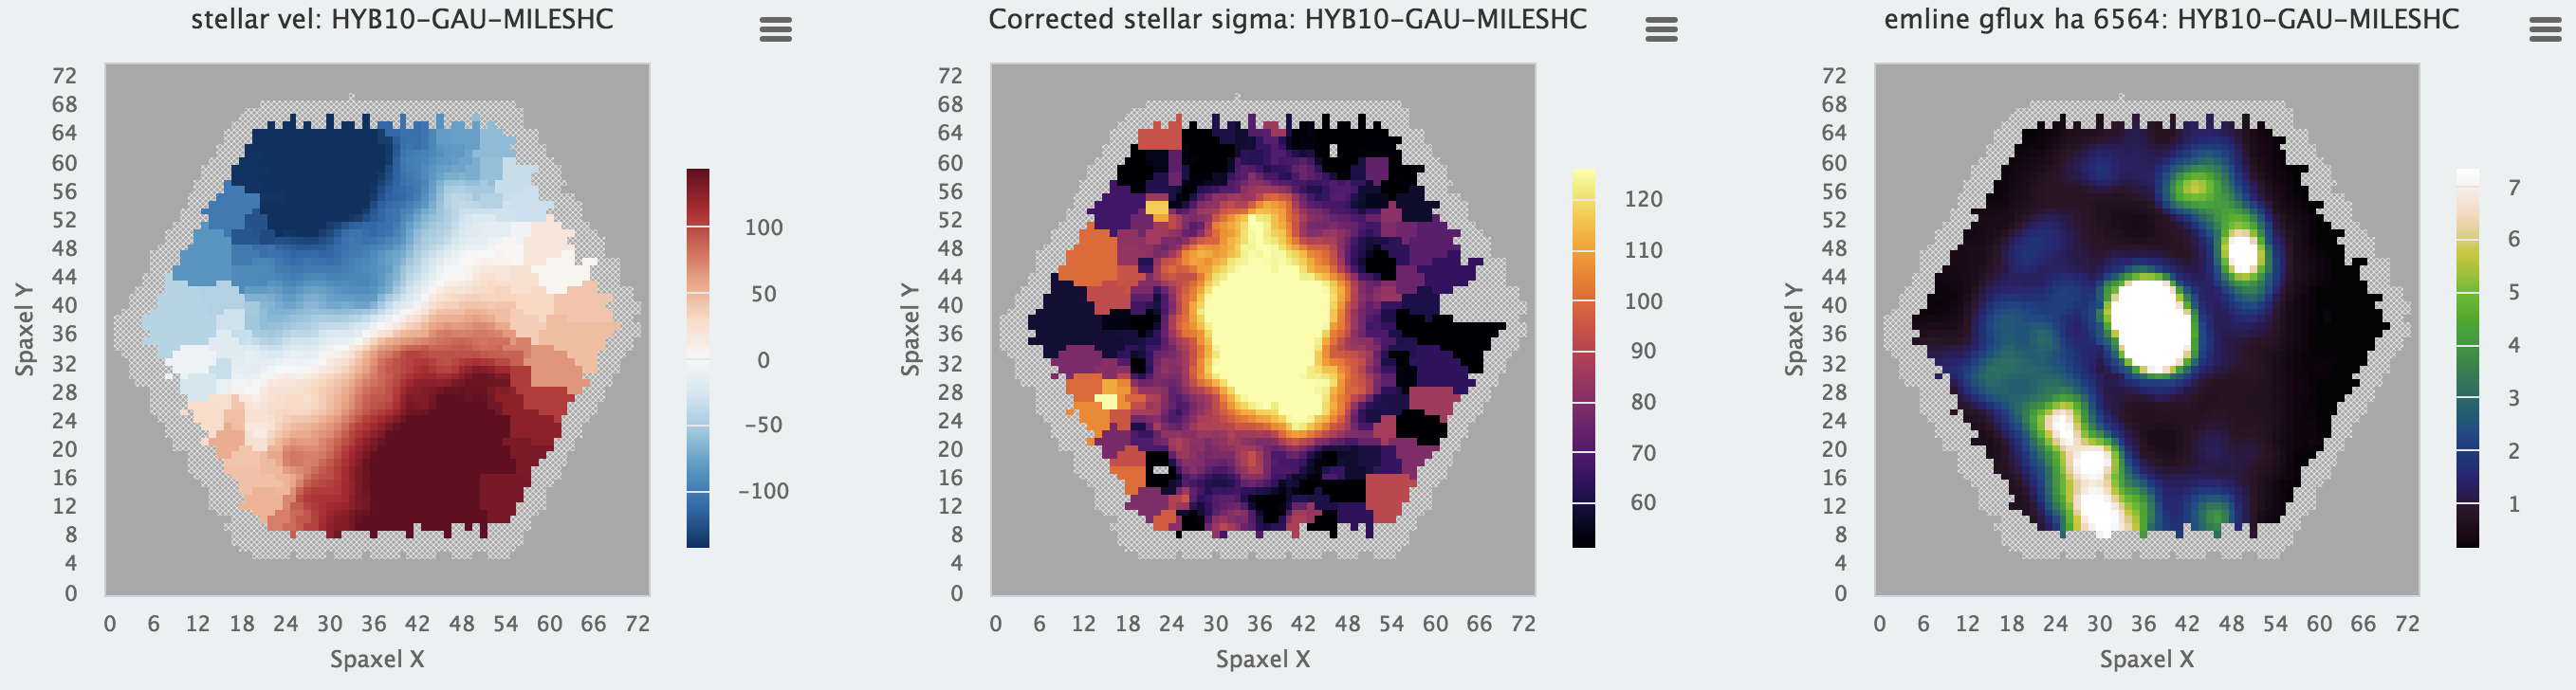
Colormaps in the wild.
Don't make me think!
Take advantage of human perception.
Data-Ink Ratio
Remove chartjunk.
Vertical Slides
Slides can be nested inside of each other.
Use the Space key to navigate through all slides.
Basement Level 1
Nested slides are useful for adding additional detail underneath a high level horizontal slide.
Basement Level 2
That's it, time to go back up.
Slides
Not a coder? Not a problem. There's a fully-featured visual editor for authoring these, try it out at https://slides.com.
Point of View
Press ESC to enter the slide overview.
Hold down alt and click on any element to zoom in on it using zoom.js. Alt + click anywhere to zoom back out.
Touch Optimized
Presentations look great on touch devices, like mobile phones and tablets. Simply swipe through your slides.
Fragments
Hit the next arrow...
... to step through ...
... a fragmented slide.
Fragment Styles
There's different types of fragments, like:
grow
shrink
fade-out
fade-right, up, down, left
fade-in-then-out
fade-in-then-semi-out
Highlight red blue green
Transition Styles
You can select from different transitions, like:
None -
Fade -
Slide -
Convex -
Concave -
Zoom
Themes
reveal.js comes with a few themes built in:
Black (default) -
White -
League -
Sky -
Beige -
Simple
Serif -
Blood -
Night -
Moon -
Solarized
Slide Backgrounds
Set data-background="#dddddd" on a slide to change the background color. All CSS color formats are supported.
Image Backgrounds
<section data-background="image.png">Tiled Backgrounds
<section data-background="image.png" data-background-repeat="repeat" data-background-size="100px">Video Backgrounds
<section data-background-video="video.mp4,video.webm">... and GIFs!
Background Transitions
Different background transitions are available via the backgroundTransition option. This one's called "zoom".
Reveal.configure({ backgroundTransition: 'zoom' })Background Transitions
You can override background transitions per-slide.
<section data-background-transition="zoom">Pretty Code
function linkify( selector ) {
  if( supports3DTransforms ) {

    var nodes = document.querySelectorAll( selector );

    for( var i = 0, len = nodes.length; i < len; i++ ) {
      var node = nodes[i];

      if( !node.className ) {
        node.className += ' roll';
      }
    }
  }
}
Code syntax highlighting courtesy of highlight.js.
Marvelous List
- No order here
- Or here
- Or here
- Or here
Fantastic Ordered List
- One is smaller than...
- Two is smaller than...
- Three!
Tabular Tables
| Item | Value | Quantity |
|---|---|---|
| Apples | $1 | 7 |
| Lemonade | $2 | 18 |
| Bread | $3 | 2 |
Clever Quotes
These guys come in two forms, inline: The nice thing about standards is that there are so many to choose from
and block:
“For years there has been a theory that millions of monkeys typing at random on millions of typewriters would reproduce the entire works of Shakespeare. The Internet has proven this theory to be untrue.”
Intergalactic Interconnections
You can link between slides internally, like this.
Speaker View
There's a speaker view. It includes a timer, preview of the upcoming slide as well as your speaker notes.
Press the S key to try it out.
Export to PDF
Presentations can be exported to PDF, here's an example:
Global State
Set data-state="something" on a slide and "something"
will be added as a class to the document element when the slide is open. This lets you
apply broader style changes, like switching the page background.
State Events
Additionally custom events can be triggered on a per slide basis by binding to the data-state name.
Reveal.addEventListener( 'customevent', function() {
	console.log( '"customevent" has fired' );
} );
Take a Moment
Press B or . on your keyboard to pause the presentation. This is helpful when you're on stage and want to take distracting slides off the screen.
Much more
- Right-to-left support
- Extensive JavaScript API
- Auto-progression
- Parallax backgrounds
- Custom keyboard bindings