Leveraging Statistics and Machine Learning for Probing Galaxy Evolution and Measuring Galaxy Distances
Brett Andrews
University of Pittsburgh
AstroLunch Seminar
05.20.2022
Acknowledgements

Cat Fielder

Biprateep Dey
- Zach Lewis, Katie Mack
- Troy Raen, Ashod Khederlarian, Yoki Hernandez
- Jeff Newman, Rachel Bezanson
- NSF AST-2009251
- NASA ADAP 80NSSC19K0588
Overview
- Milky Way as a Rosetta Stone for understanding galaxy evolution
- Deep Learning Photometric Redshifts
- Correcting Photometric Redshift Systematics
Milky Way as a Rosetta Stone for understanding galaxy evolution
Galaxy Evolution
Tracing A Galaxy's Formation History
- dark matter halo assembly history
- merger history
- star formation history
- chemical enrichment history
- supermassive black hole accretion history
Historical disconnect between Milky Way and extragalactic communities.
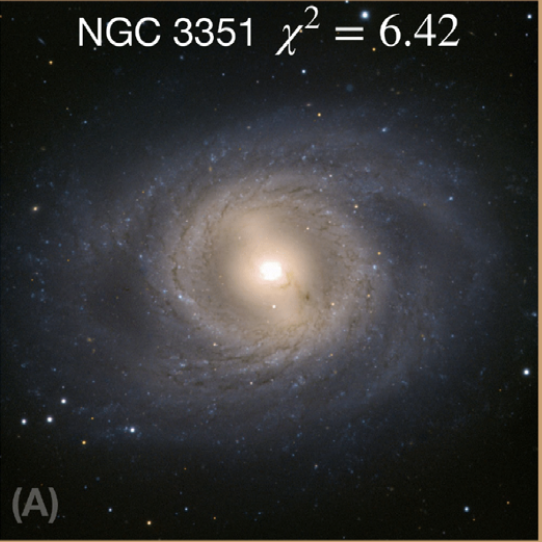
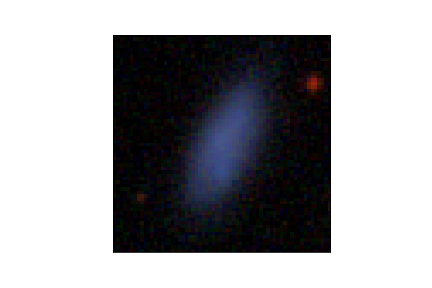
NGC 3351
Fielder, Newman, Andrews, et al. (2021)
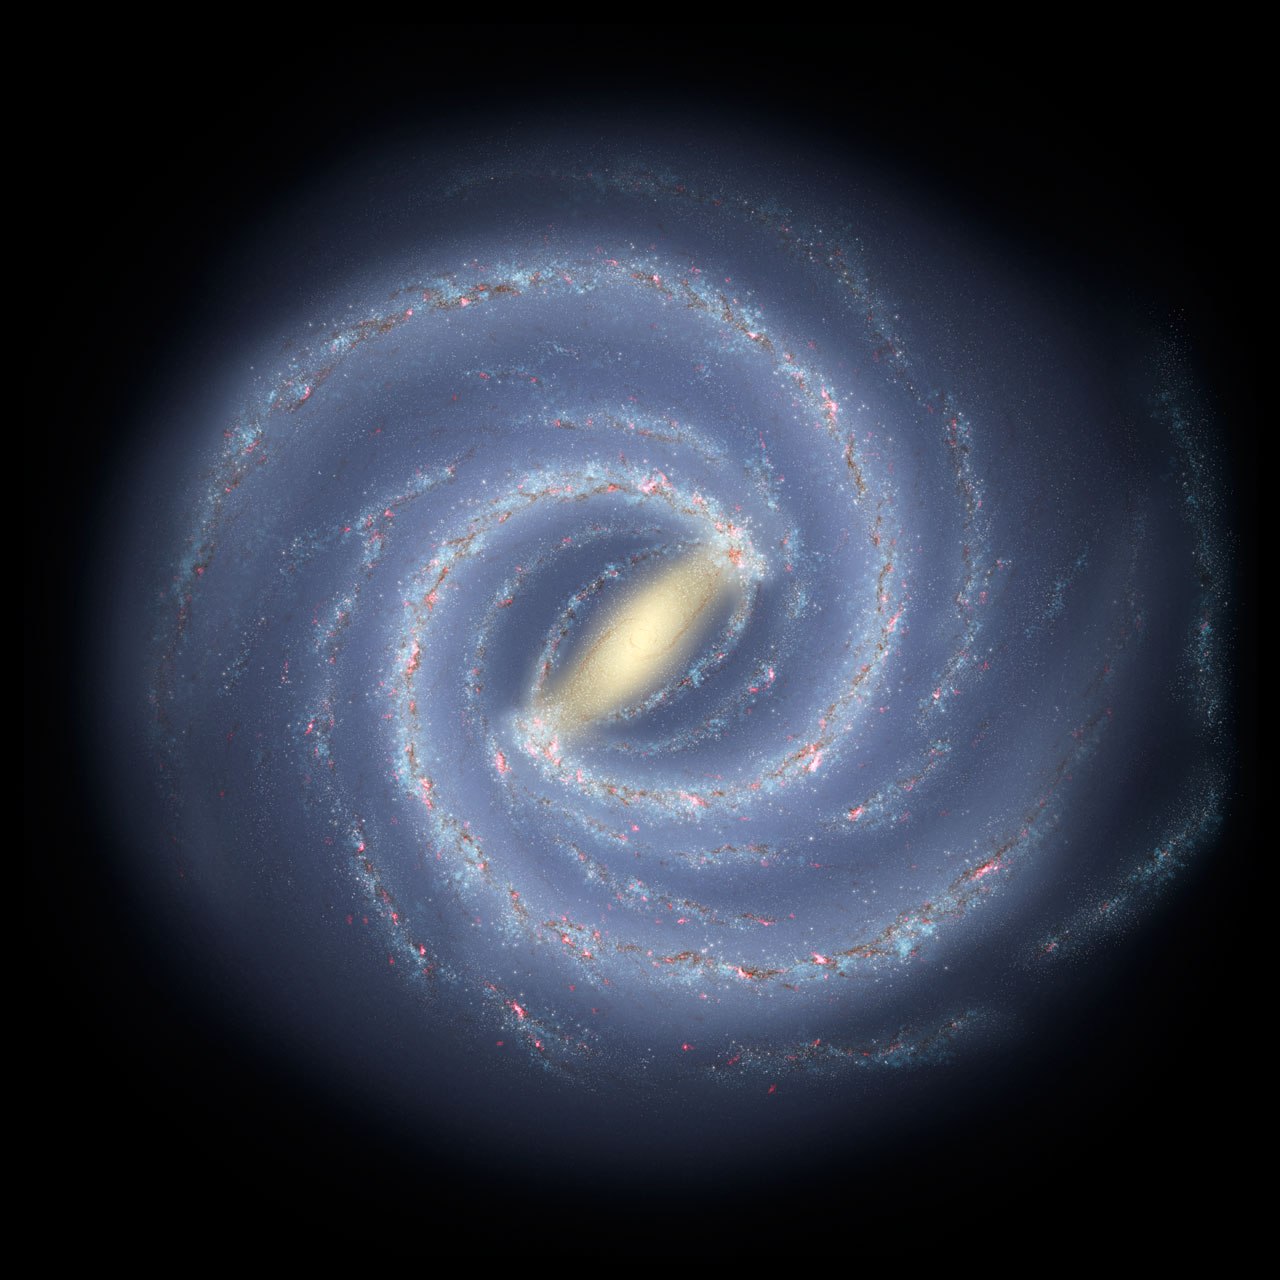
Milky Way (artist impression)
NASA/JPL-Caltech/ESO/R. Hurt
- Test methods used on external galaxies (e.g., SED-fitting) with unique Milky Way observational constraints (e.g., from resolved stellar populations).
- Provide tighter constraints for hydrodynamical models of MW-like galaxies to more accurately tune their feedback prescriptions.
Milky Way: unique observations and simulations
- satellite populations (SDSS, DES)
- properties for ~millions of stars across the Milky Way
- 6-D position-velocity data (Gaia)
- 10-20 element stellar abundances (APOGEE/APOGEE-2, GALAH, Gaia-ESO)
- reconstruct the Milky Way star formation history w/ chemical evolution models
- detailed hydrodynamical cosmological simulations
(EAGLE, FIRE, Auriga)
Our perspective of the Milky Way is different than for most external galaxies.
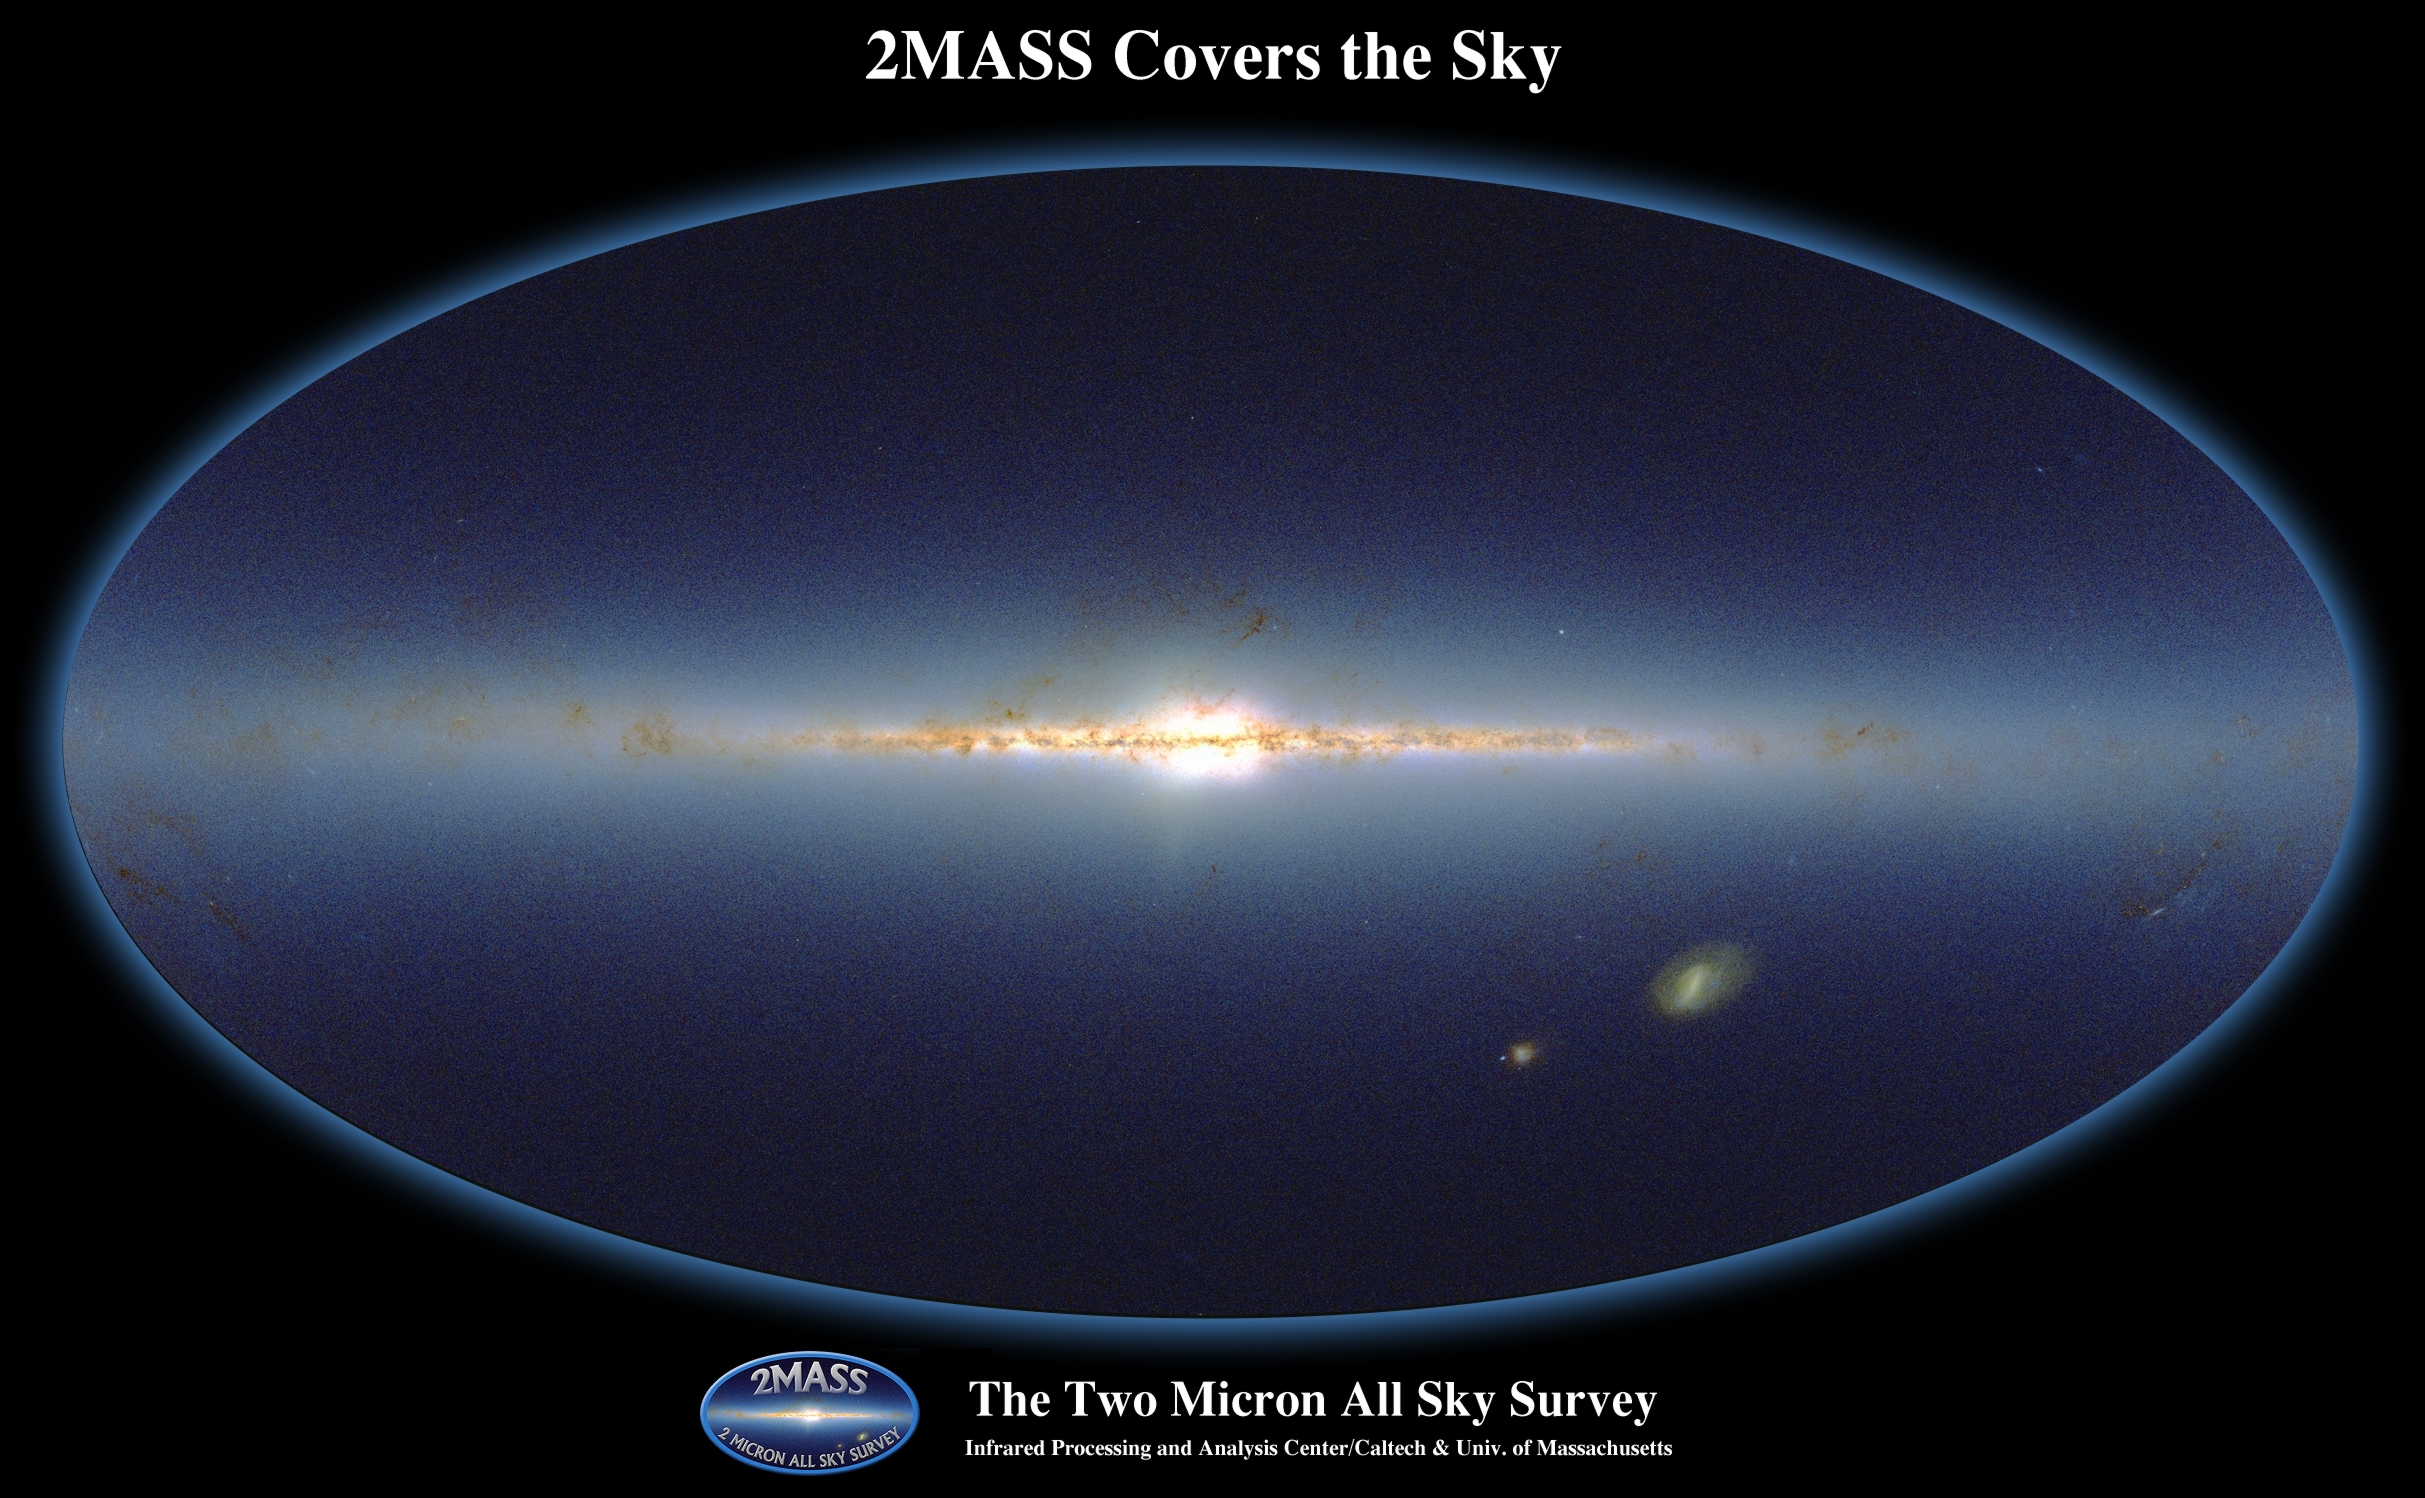
Near-IR
Credit: IPAC
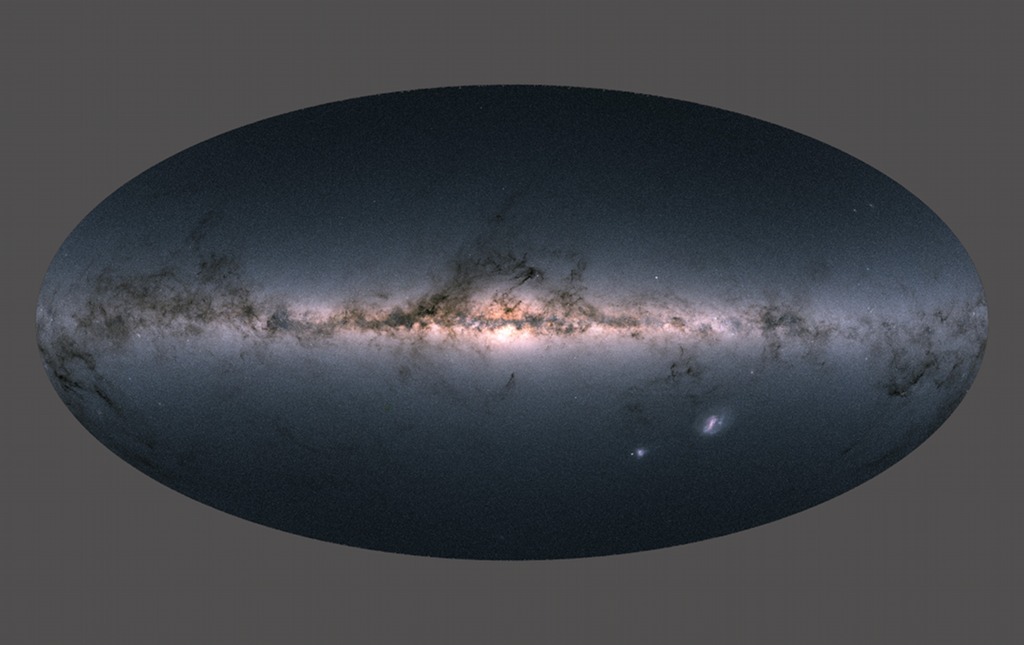
Optical
Credit: ESA, Gaia, DPC
What is the color of the Milky Way?
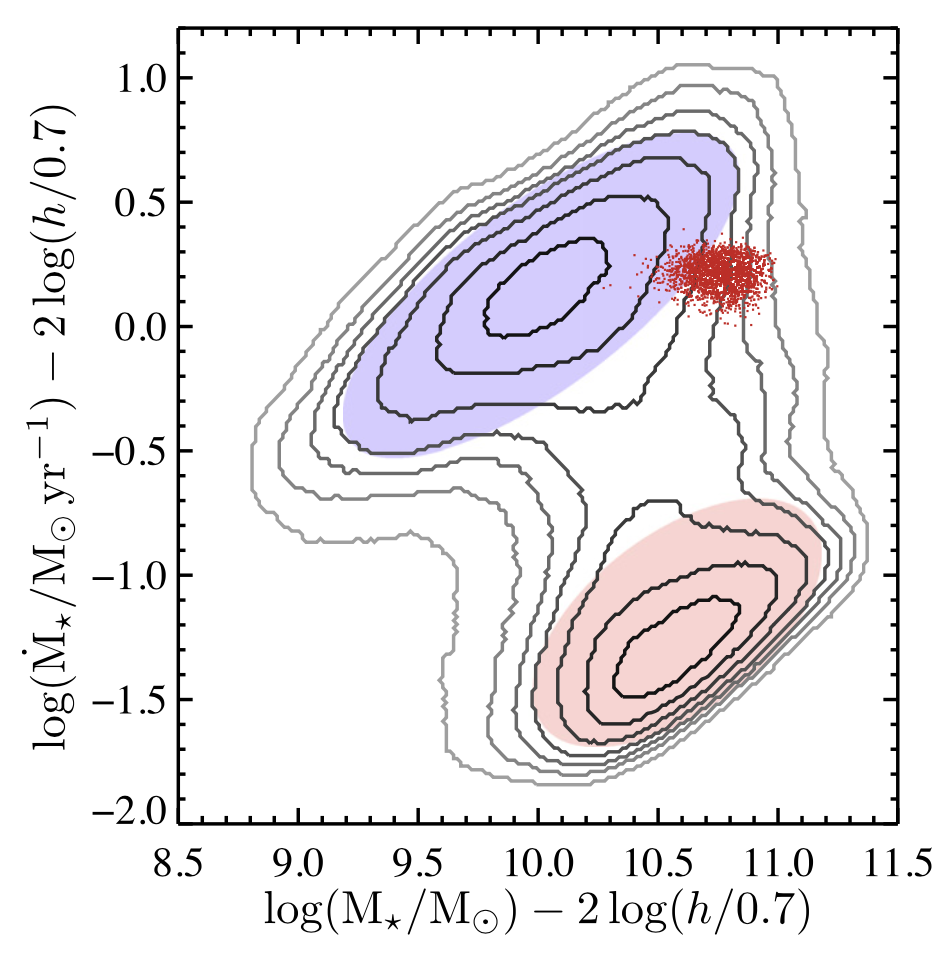
Milky Way Analogs: similar Mstar and SFR
Licquia, Newman, & Brinchmann (2015)
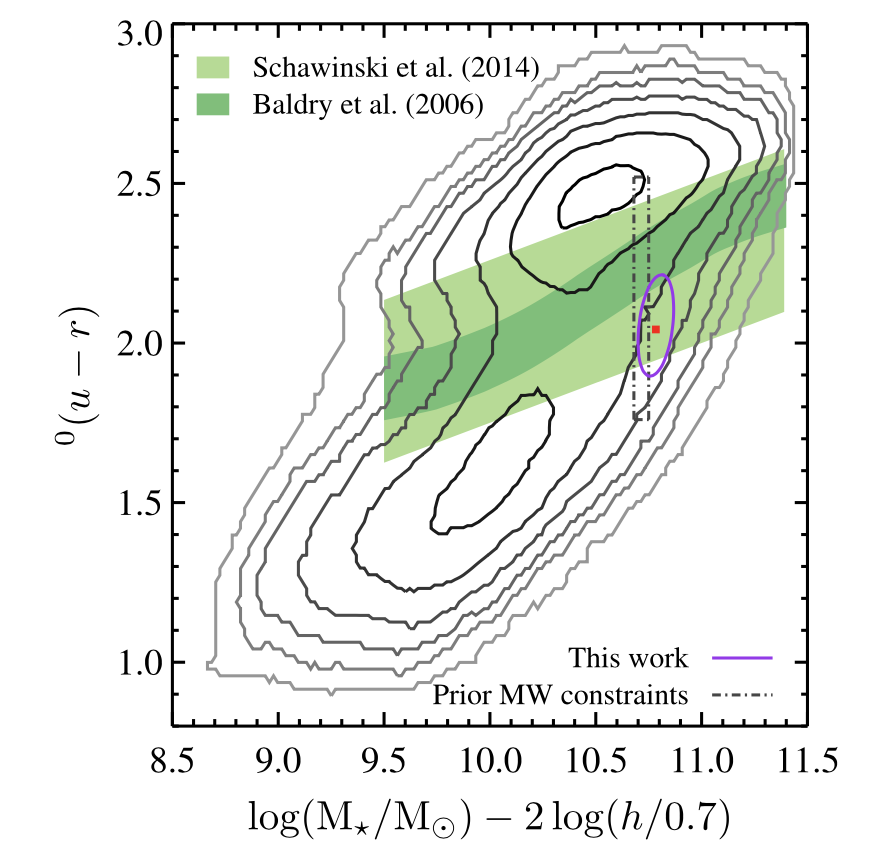
- Milky Way is in the optical Green Valley
- Is MW transitioning from star-forming to quiescent?
Licquia, Newman, & Brinchmann (2015)
Estimate the Milky Way's UV-to-IR Spectral Energy Distribution (SED)
- SED: fundamental observable for external galaxies and bolometric luminosity.
- Do the UV and IR indicate that the Milky Way is transitioning from star-forming to quiescent?
- GALEX-SDSS-WISE Legacy Catalog
- Quickly run out of close analogs with 4+ parameters
Boardman, Zasowski, Newman, Andrews, Fielder, et al. (2020)
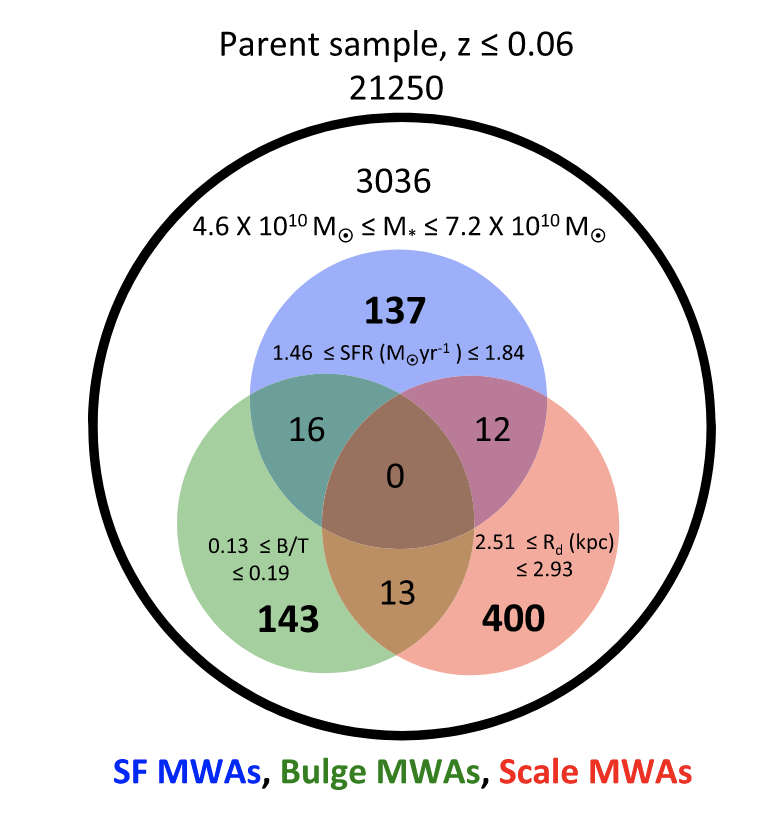
Solution: Go Big
Use a broader galaxy sample and regress across it.
Fielder, Newman, Andrews, et al. (2021)
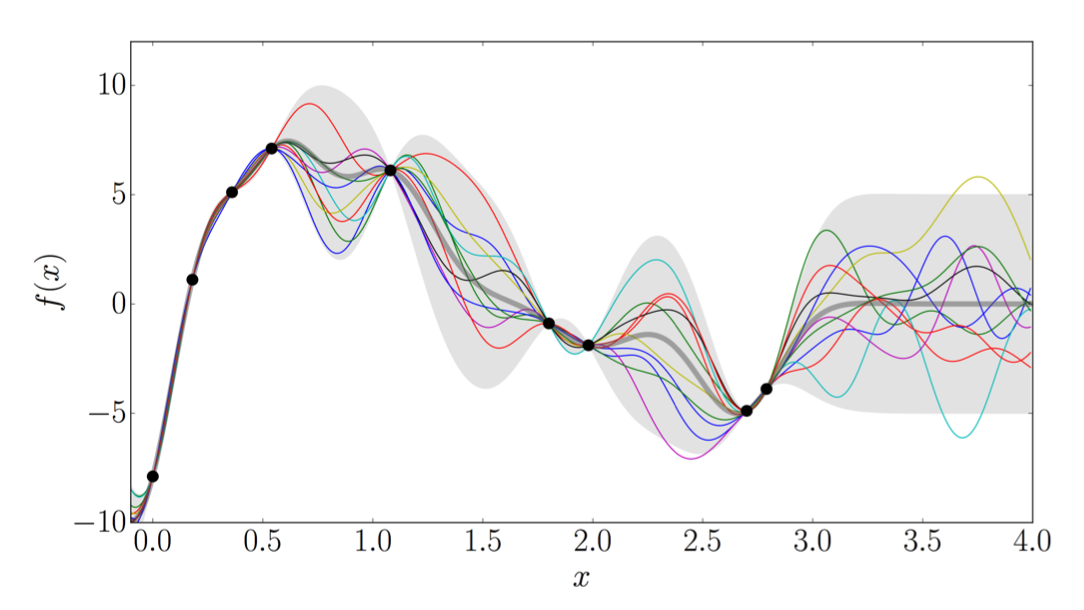
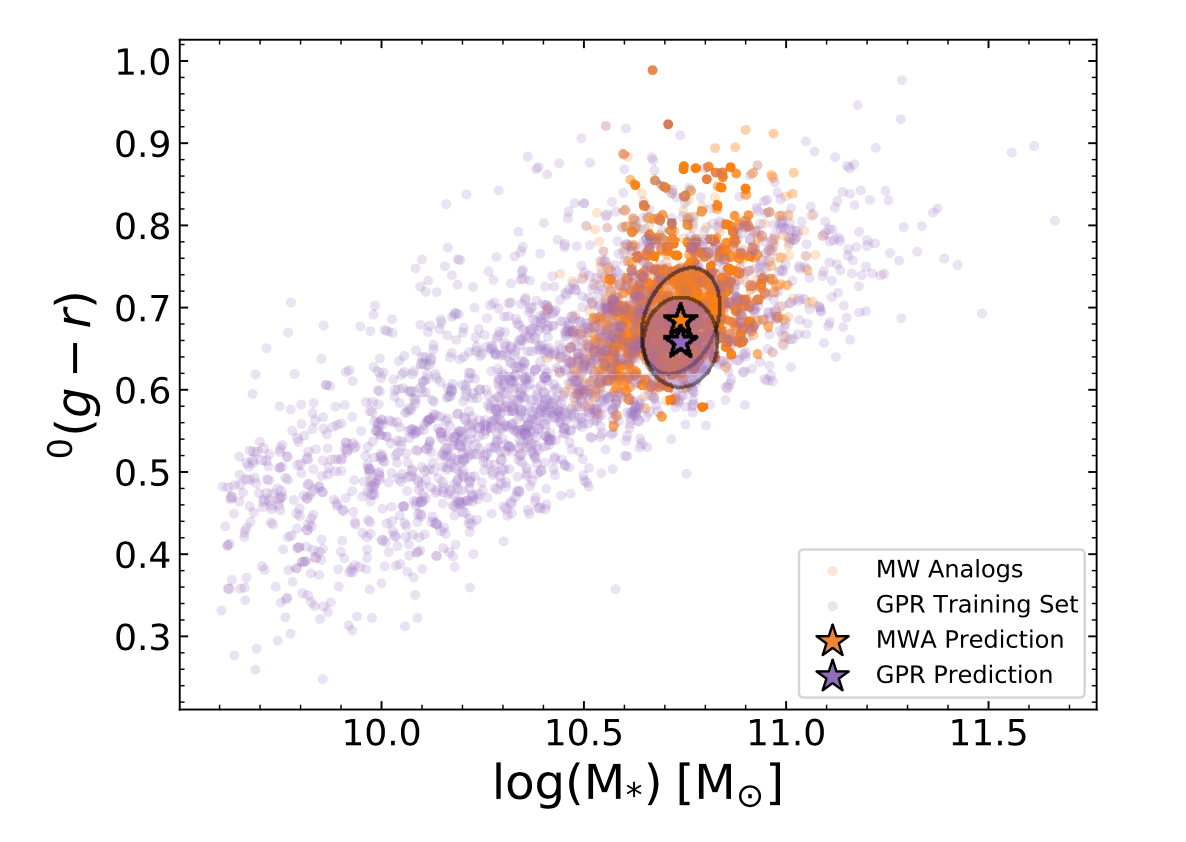
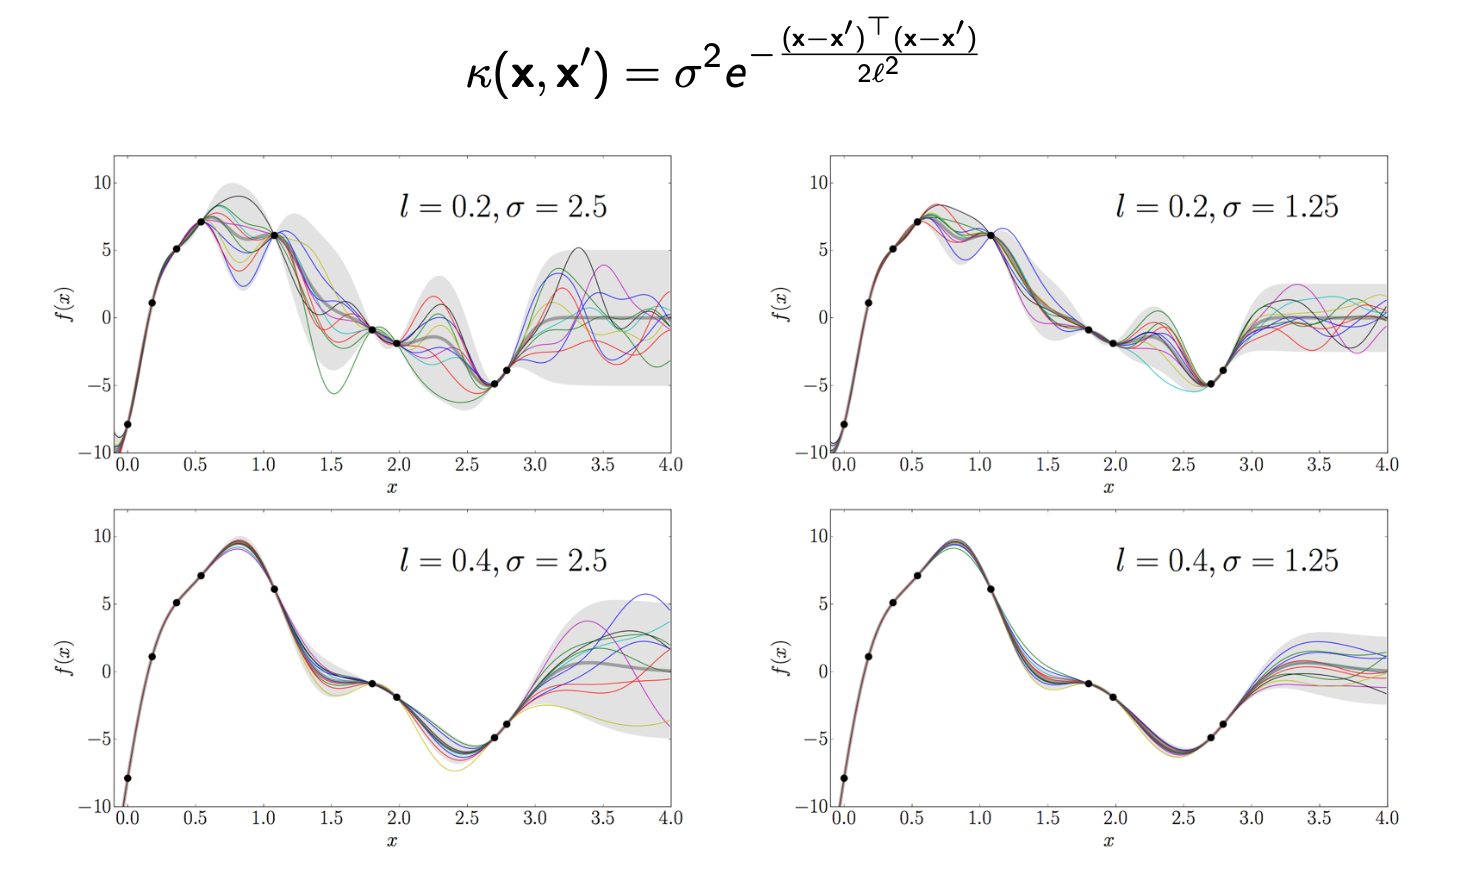
Gaussian Process Regression
- Bayesian flexible non-parametric interpolation
- Data constrains model predictions
- Select kernel (covariance matrix) and optimize hyperparameters with training data
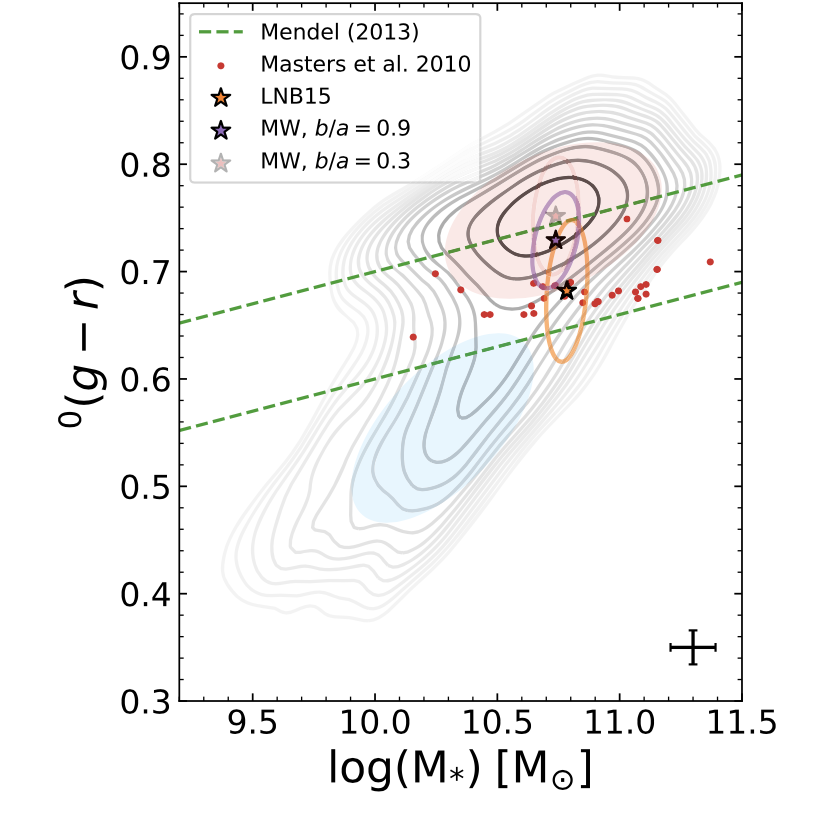
The Milky Way is in the optical Green Valley...
Fielder, Newman, Andrews, et al. (2021)
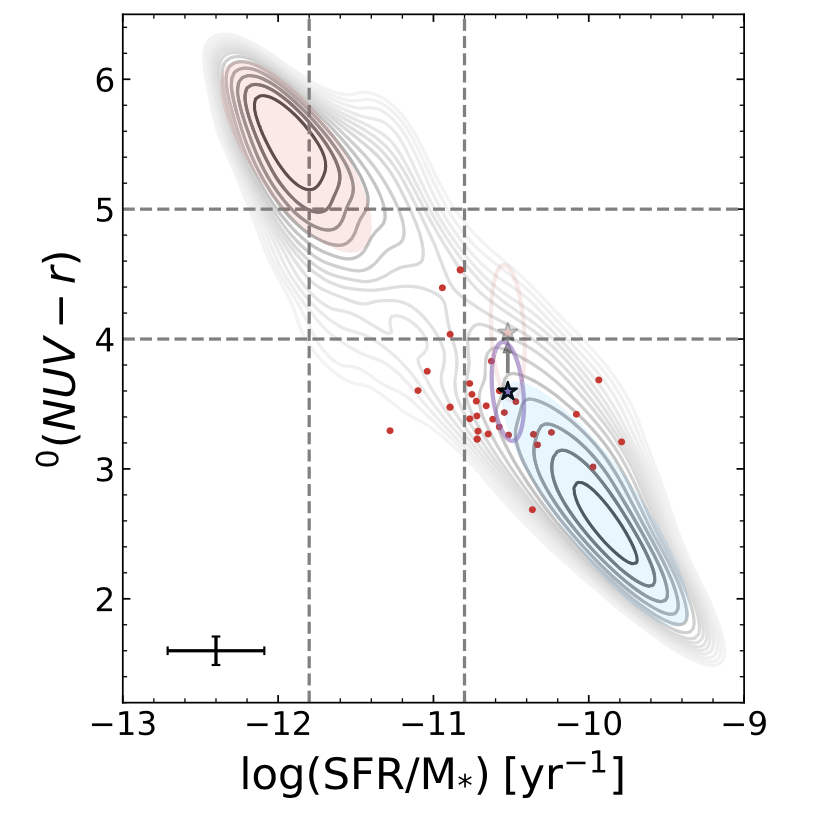
...but the Milky Way is star-forming in the UV
Fielder, Newman, Andrews, et al. (2021)
What does the IR say?
- For all bands, we use K-corrections to convert from observed frame to rest-frame.
- Issue:
KCORRECTtemplates fail on WISE W4 (22 μm). - Solution: Data-driven K-corrections.
- Assume galaxies with similar rest-frame color in one band (e.g., g-r) have similar SEDs (e.g., Connolly et al. 1995).
- Fit trend of similar galaxies with redshift to get K-corrections.
- K-corrections extrapolate down to z=0.
Fielder, Andrews, Newman, et al. (in prep.)
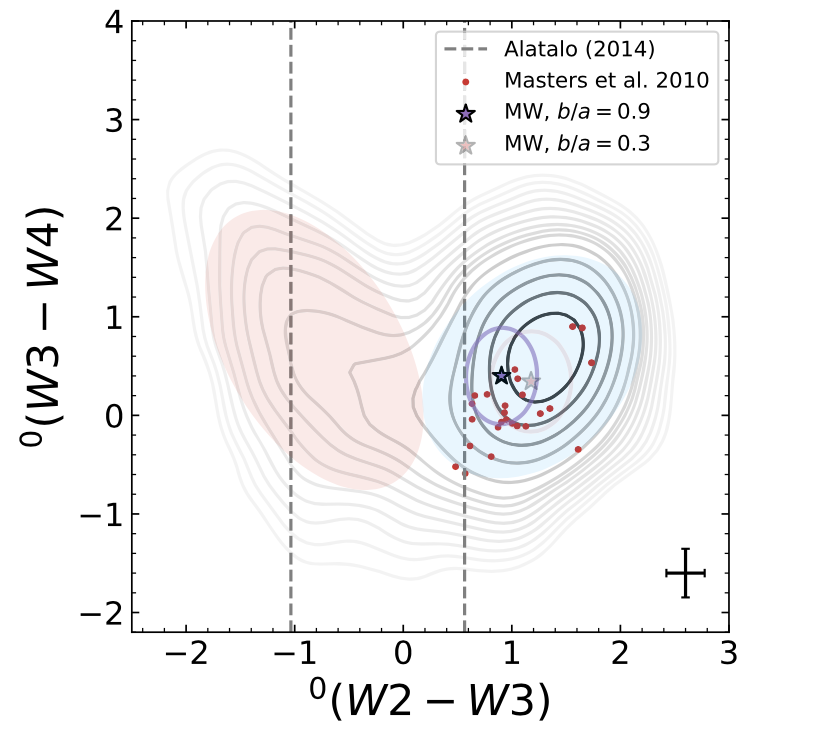
Milky Way is star-forming in IR!
Fielder, Newman, Andrews, et al. (2021)
Milky Way as a Red Spiral
- Massive star-forming galaxies are optically red due to large old stellar populations.
- High mass end of the blue cloud overlaps with red sequence in the optical.
- UV and IR are more sensitive to star formation.
- Milky Way is a star-forming galaxy and not transitioning to quiescence.
Fielder, Newman, Andrews, et al. (2021)
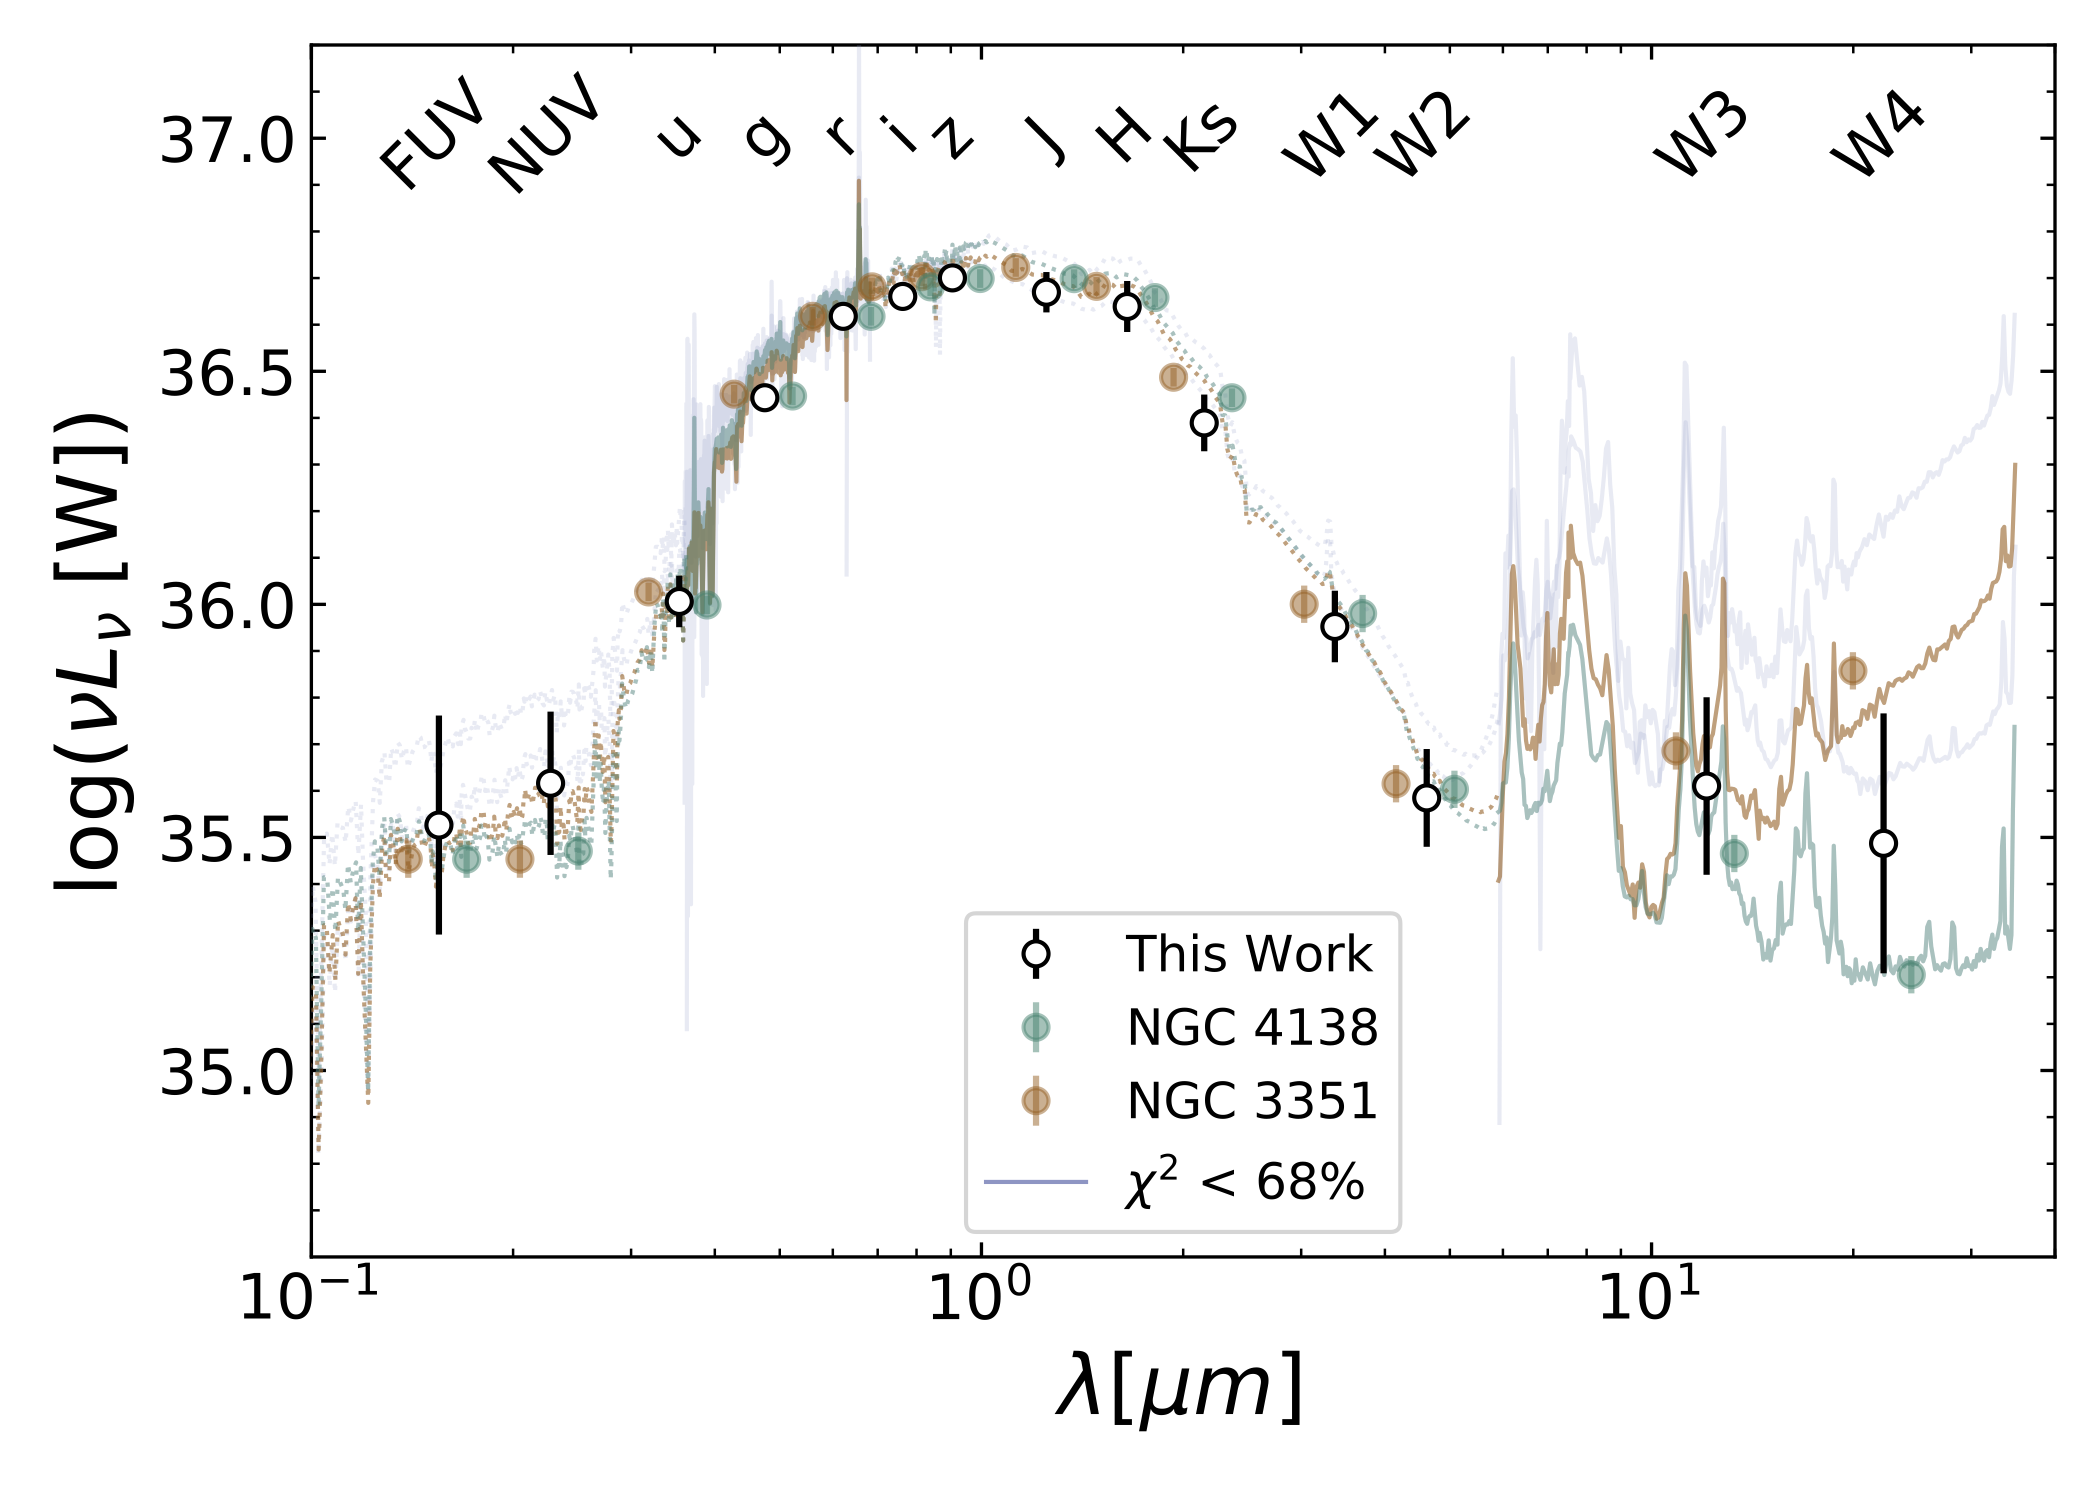
Milky Way UV-to-IR SED
Fielder, Newman, Andrews, et al. (2021)
[Next] Measure the Milky Way's star formation history (SFH) with SED-fitting
- Key technical challege: Need to capture covariance between bands with multi-task Gaussian Process Regression
- Fit our Milky Way SED to estimate its SFH.
- Compare to Milky Way SFH estimates from stellar abundance surveys and chemical evolution models.
Fielder, Newman, Andrews, et al. (2021)
Other Galaxy Evolution Projects
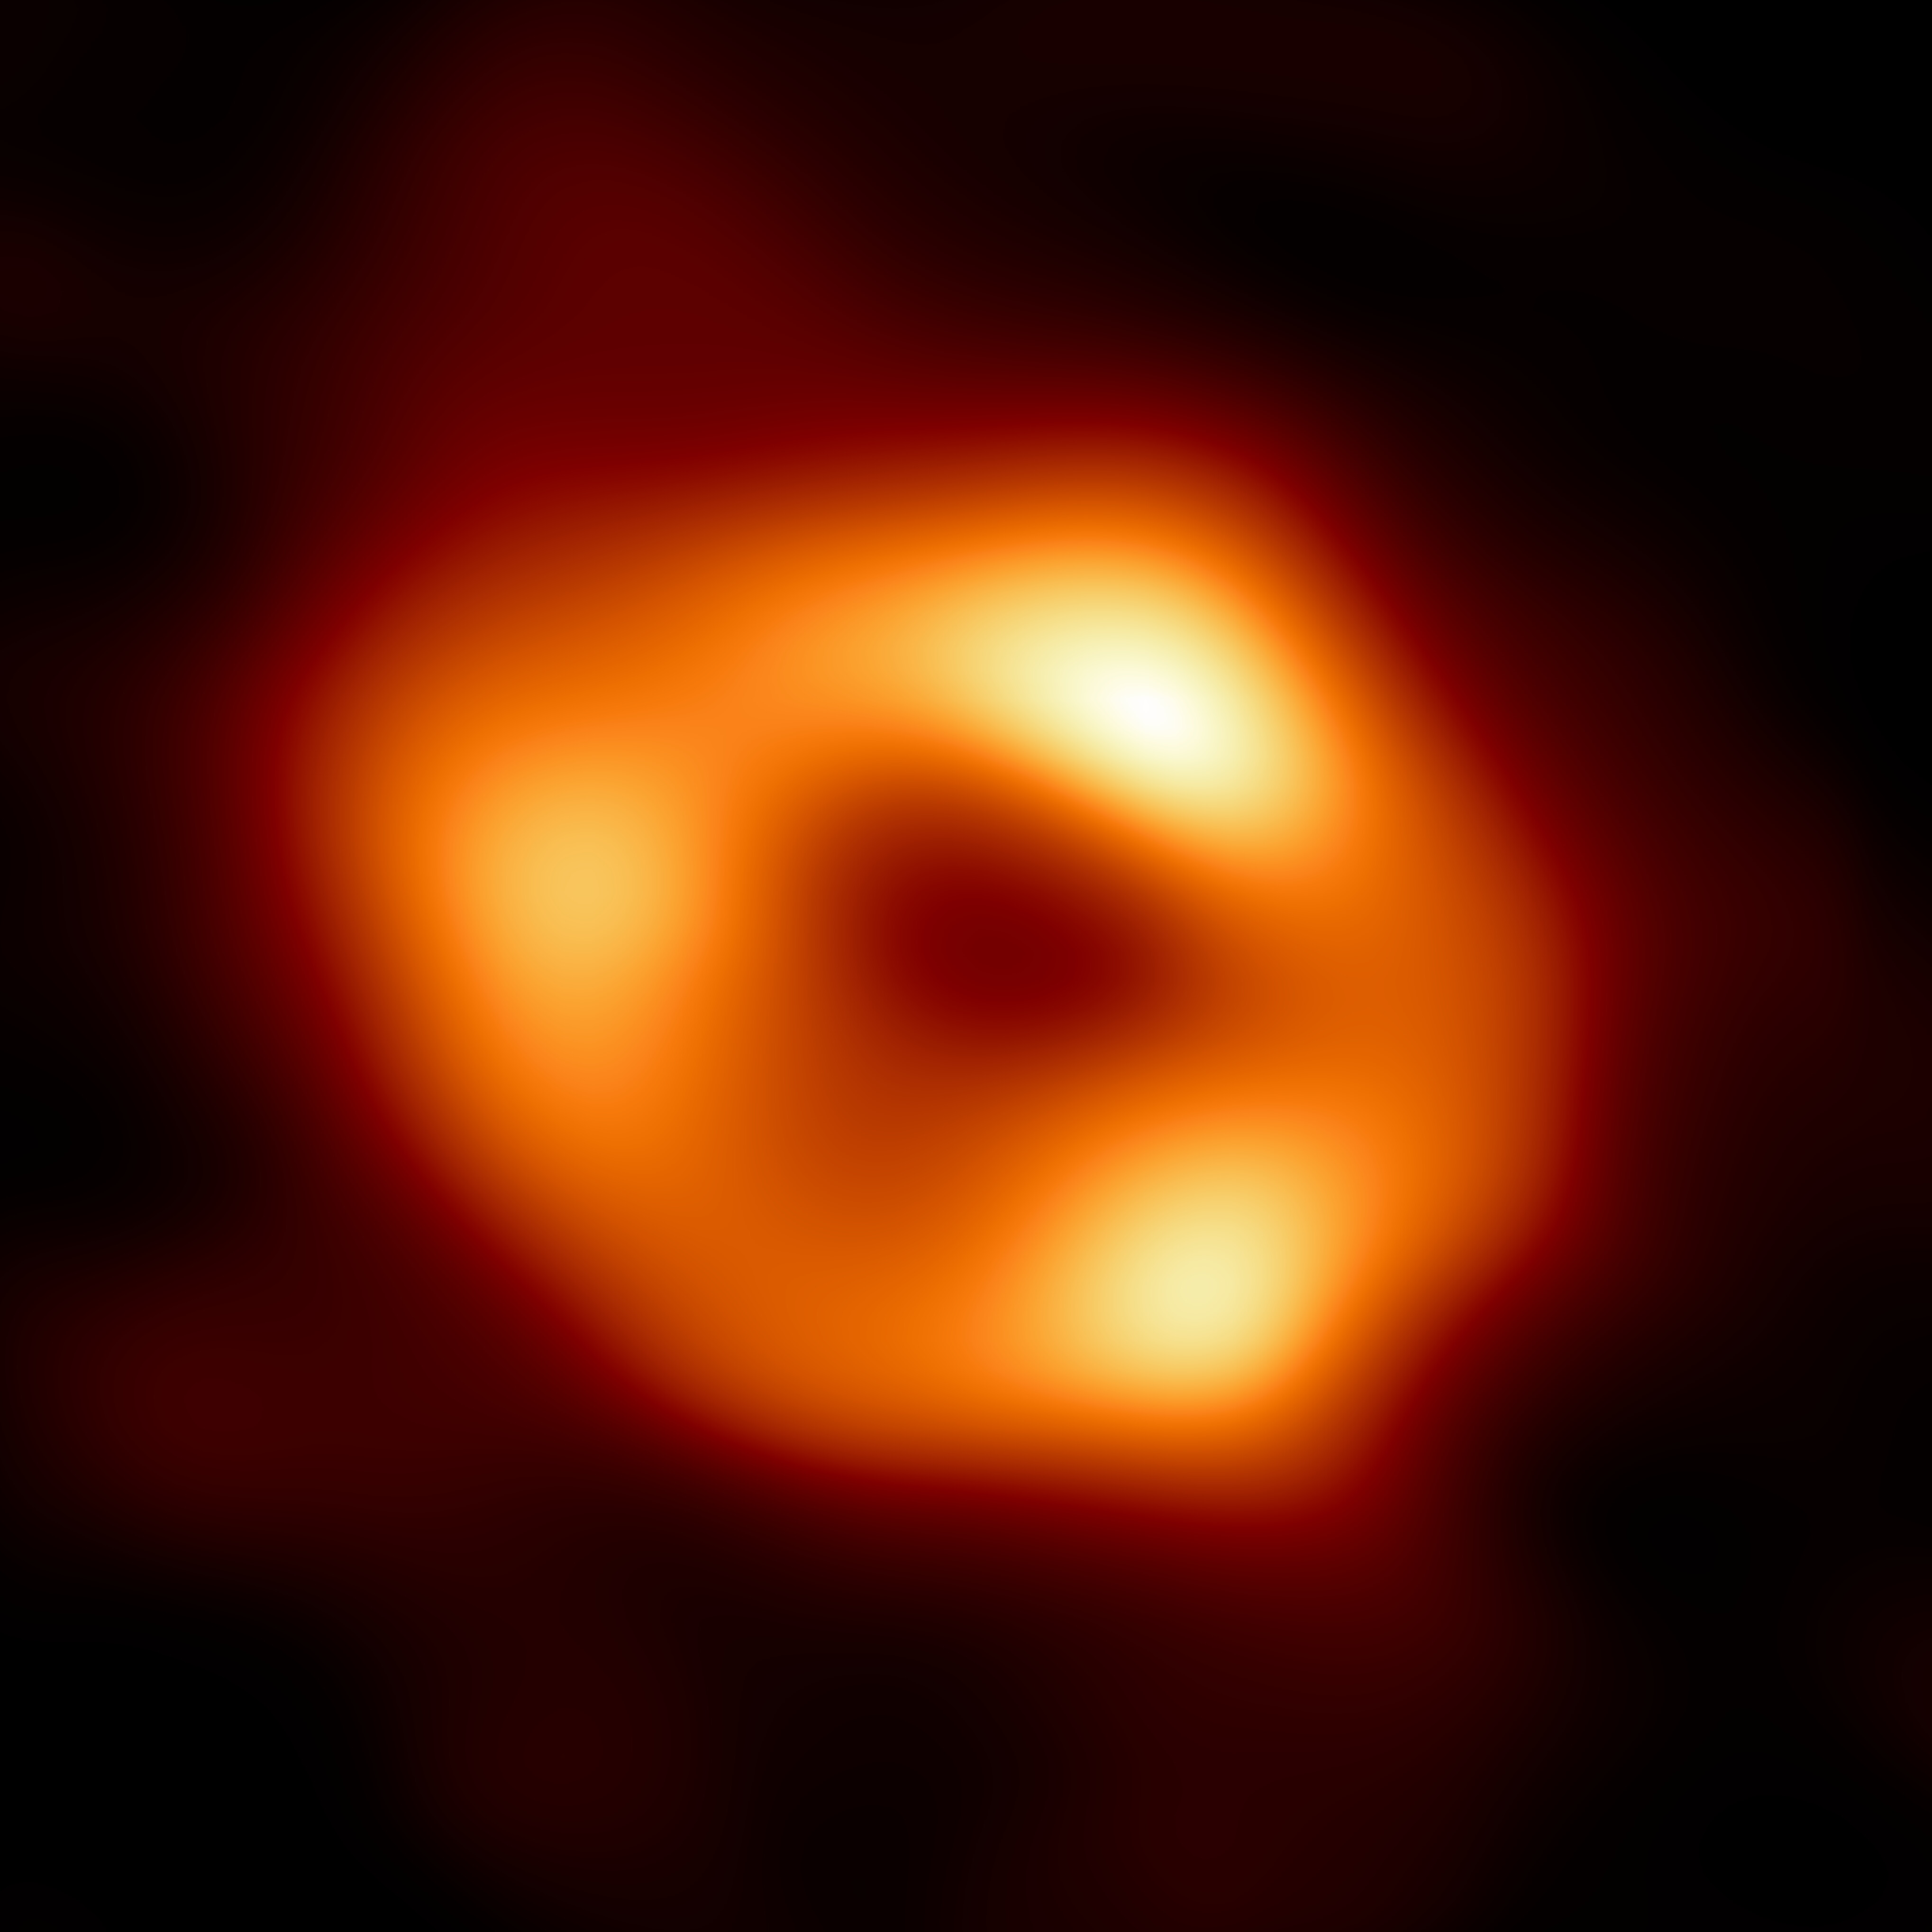
Milky Way's Supermassive Black Hole
- The Milky Way's central supermassive black hole is currently dormant...
- ...but it must have built up its mass.
Credit: EHT Collaboration
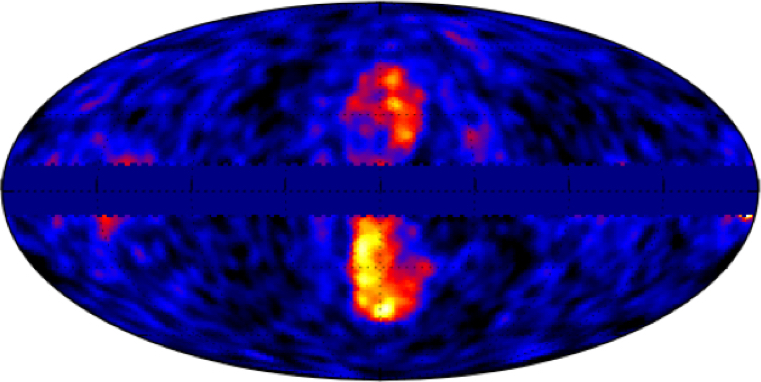
Fermi Bubbles: Evidence of Past Activity?
Credit: Fermi-LAT team, A. Franckowiak, D. Malyshev
What is fraction of the time is it "on"?
- Archival XMM-Newton X-ray data of ~100 Milky Way Analogs.
- 7 objects identified as 5σ point sources.
- However, we can statistically combine lower significance detections to do better.
- We will do a differential measurement relative to X-ray flux of random nearby pointings.
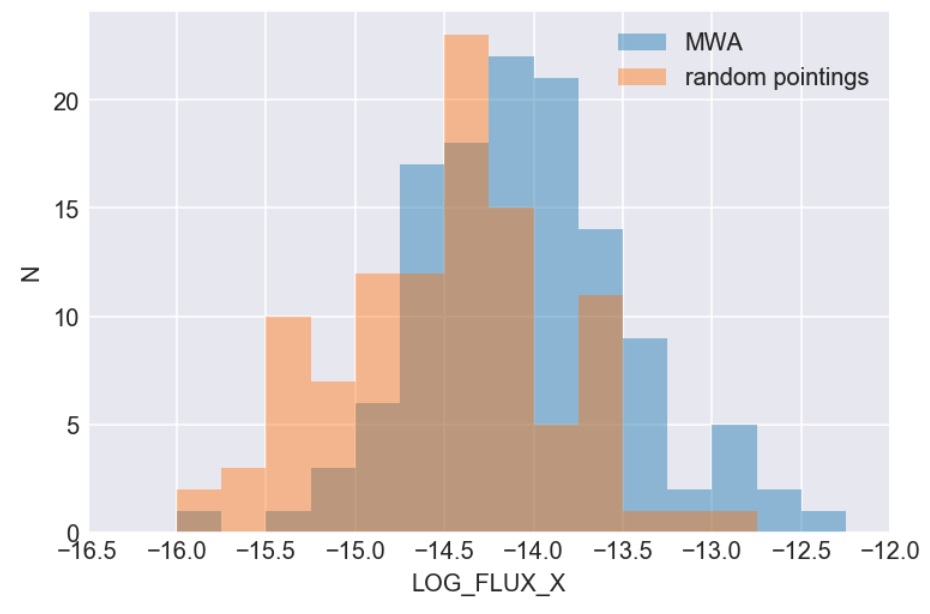
- Duty Cycle: what fraction of time is it actively accreting (Lx > 10^41 erg/s)
- Average Accretion Luminosity: when it's on, how bright is it?
High(er) Redshift Projects
- Mass-Metallicity Relation at z~0.8(Zach Lewis, Andrews, Bezanson, et al. in prep.)
- Dust Attenuation Properties at z~0.8(Katie Mack, Zach Lewis, Bezanson, Andrews, et al. in prep.)
- Post-starburst Galaxy Fraction out to z~1
(David Setton, Dey, Newman, Bezanson, Andrews, et al. in prep.)
Deep Learning Photometric Redshifts
Galaxy Redshifts are Essential
- Cosmology
- Galaxy evolution
- Multi-messenger astronomy
- Dark matter physics
But spectroscopic redshifts of large samples of faint galaxies are prohibitively resource-intensive.
Photometric Redshifts!
Template-based Methods
- physics-based SED-fitting
- Pros: best in regimes with little training data (e.g., high-z)
- Cons: limited by our knowledge of galaxy physics (e.g., template mismatch)
Machine Learning Methods
- data-driven
- Pros: best for regimes with abundant training data and complete spectroscopic coverage of color-redshift space (e.g., low-z)
- Cons: spectroscopic incompleteness (biased training sets)
Most photo-z methods use photometry (integrate over galaxy)
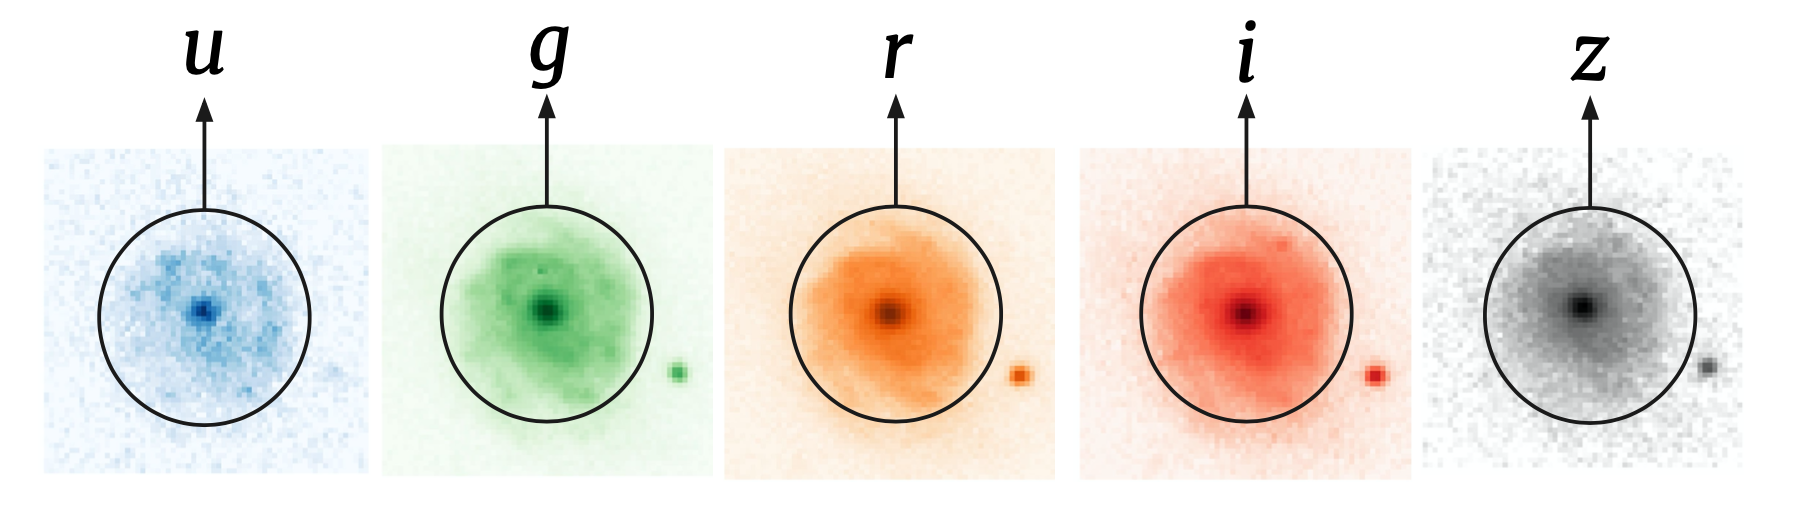
Fig. coutesy of Biprateep Dey
Can we leverage pixel-level information to improve photo-z estimates?
- Deep learning, especially convolution neural networks (CNNs), have proven to be extremely effective at image processing.
- At low-z (z < 0.5), photo-z's are well-suited for deep learning.
- Can break SED degeneracies with size/morphology, especially at very low redshifts (z < 0.05).
Capsule Networks
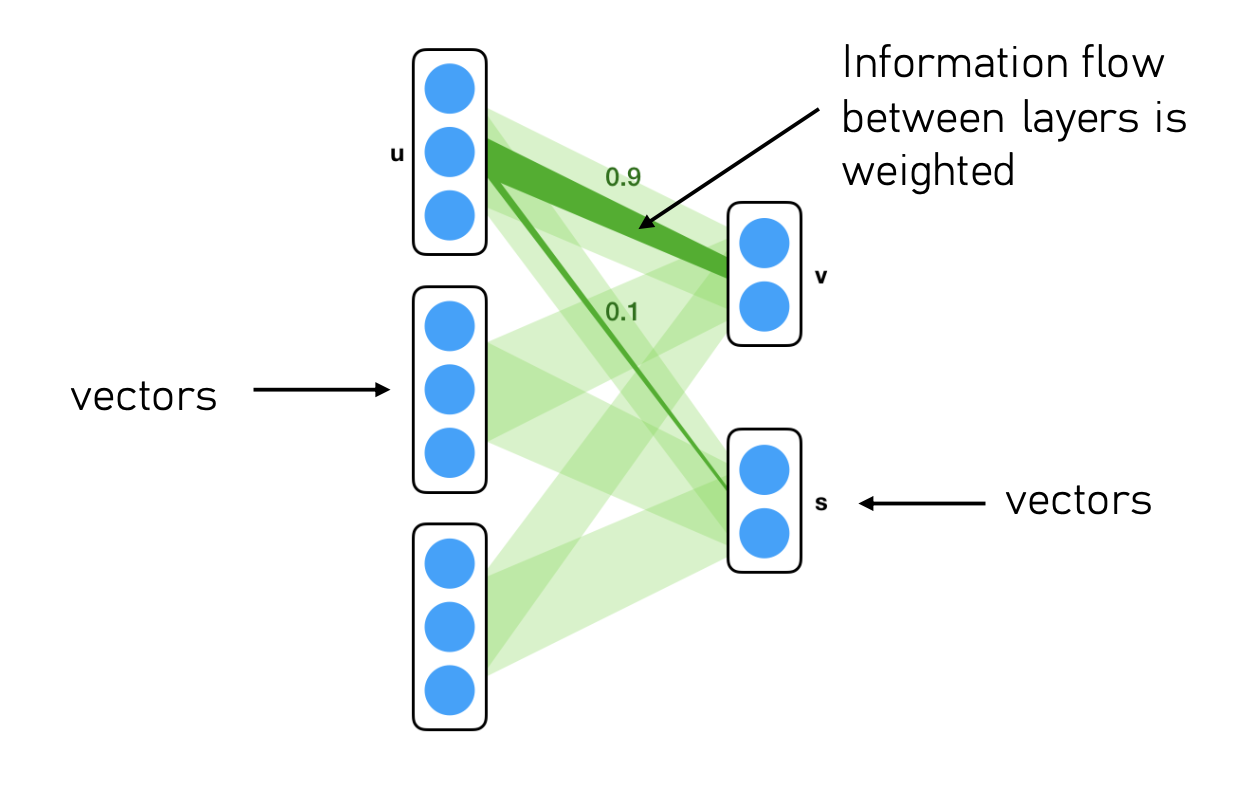
Fig. coutesy of Biprateep Dey
- Capsule: collection of neurons that acts as a vector analog to scalar neurons.
- Interpretable: final capsule encodes galaxy info
- Strong Generalizability: Requires less training data than CNNs to learn novel viewpoints.
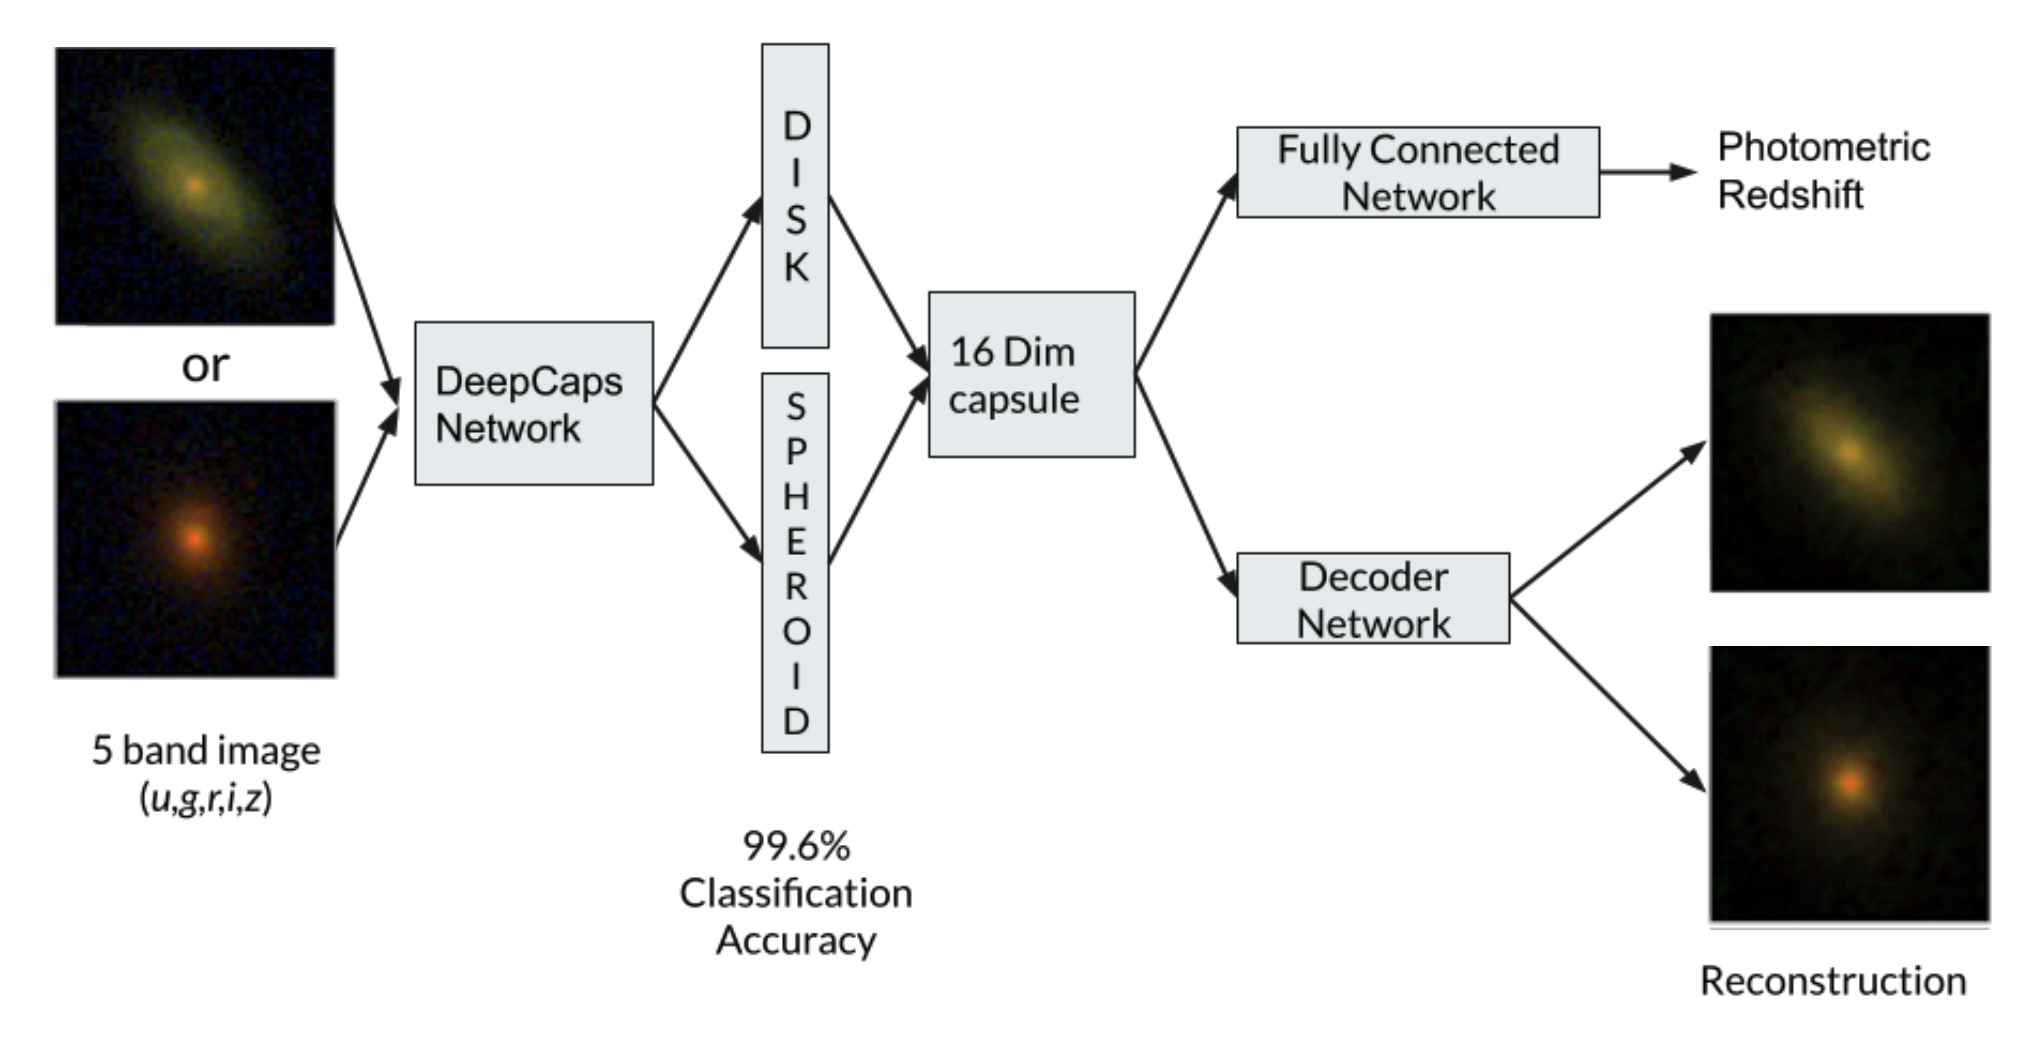
Capsule Network Architecture
Total loss combines classification, decoder, and redshift regression losses.
Fig. coutesy of Biprateep Dey
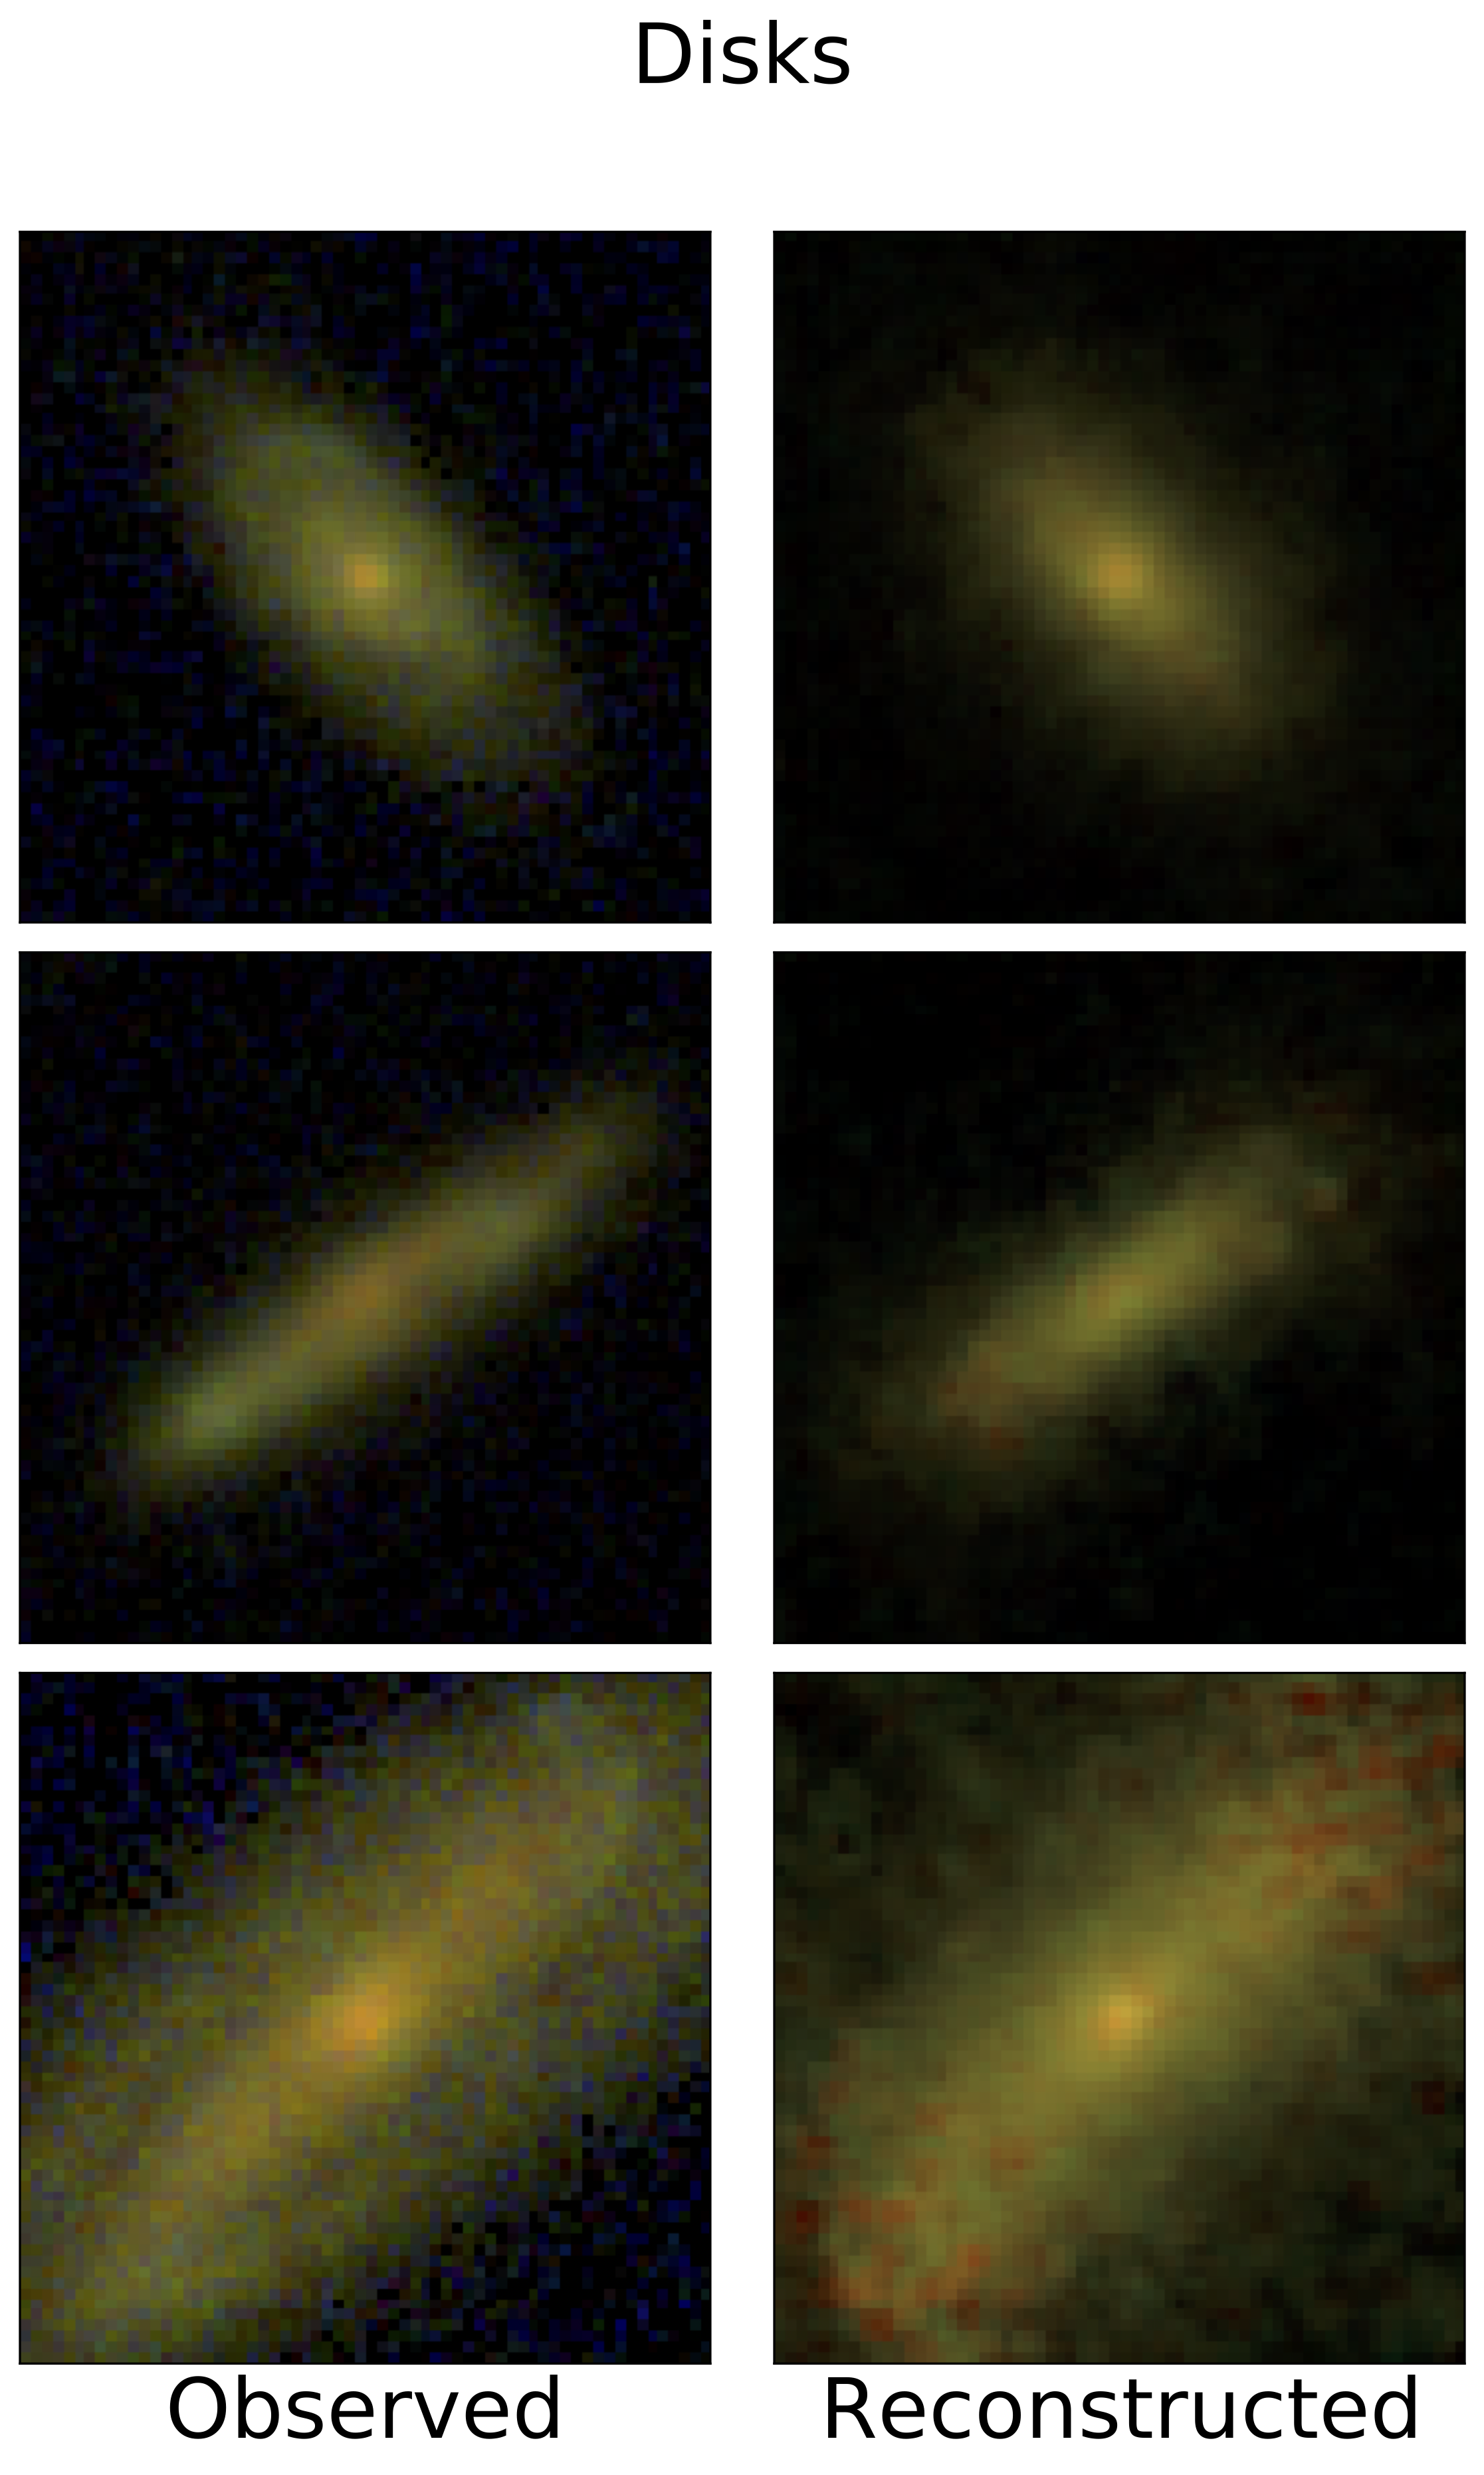
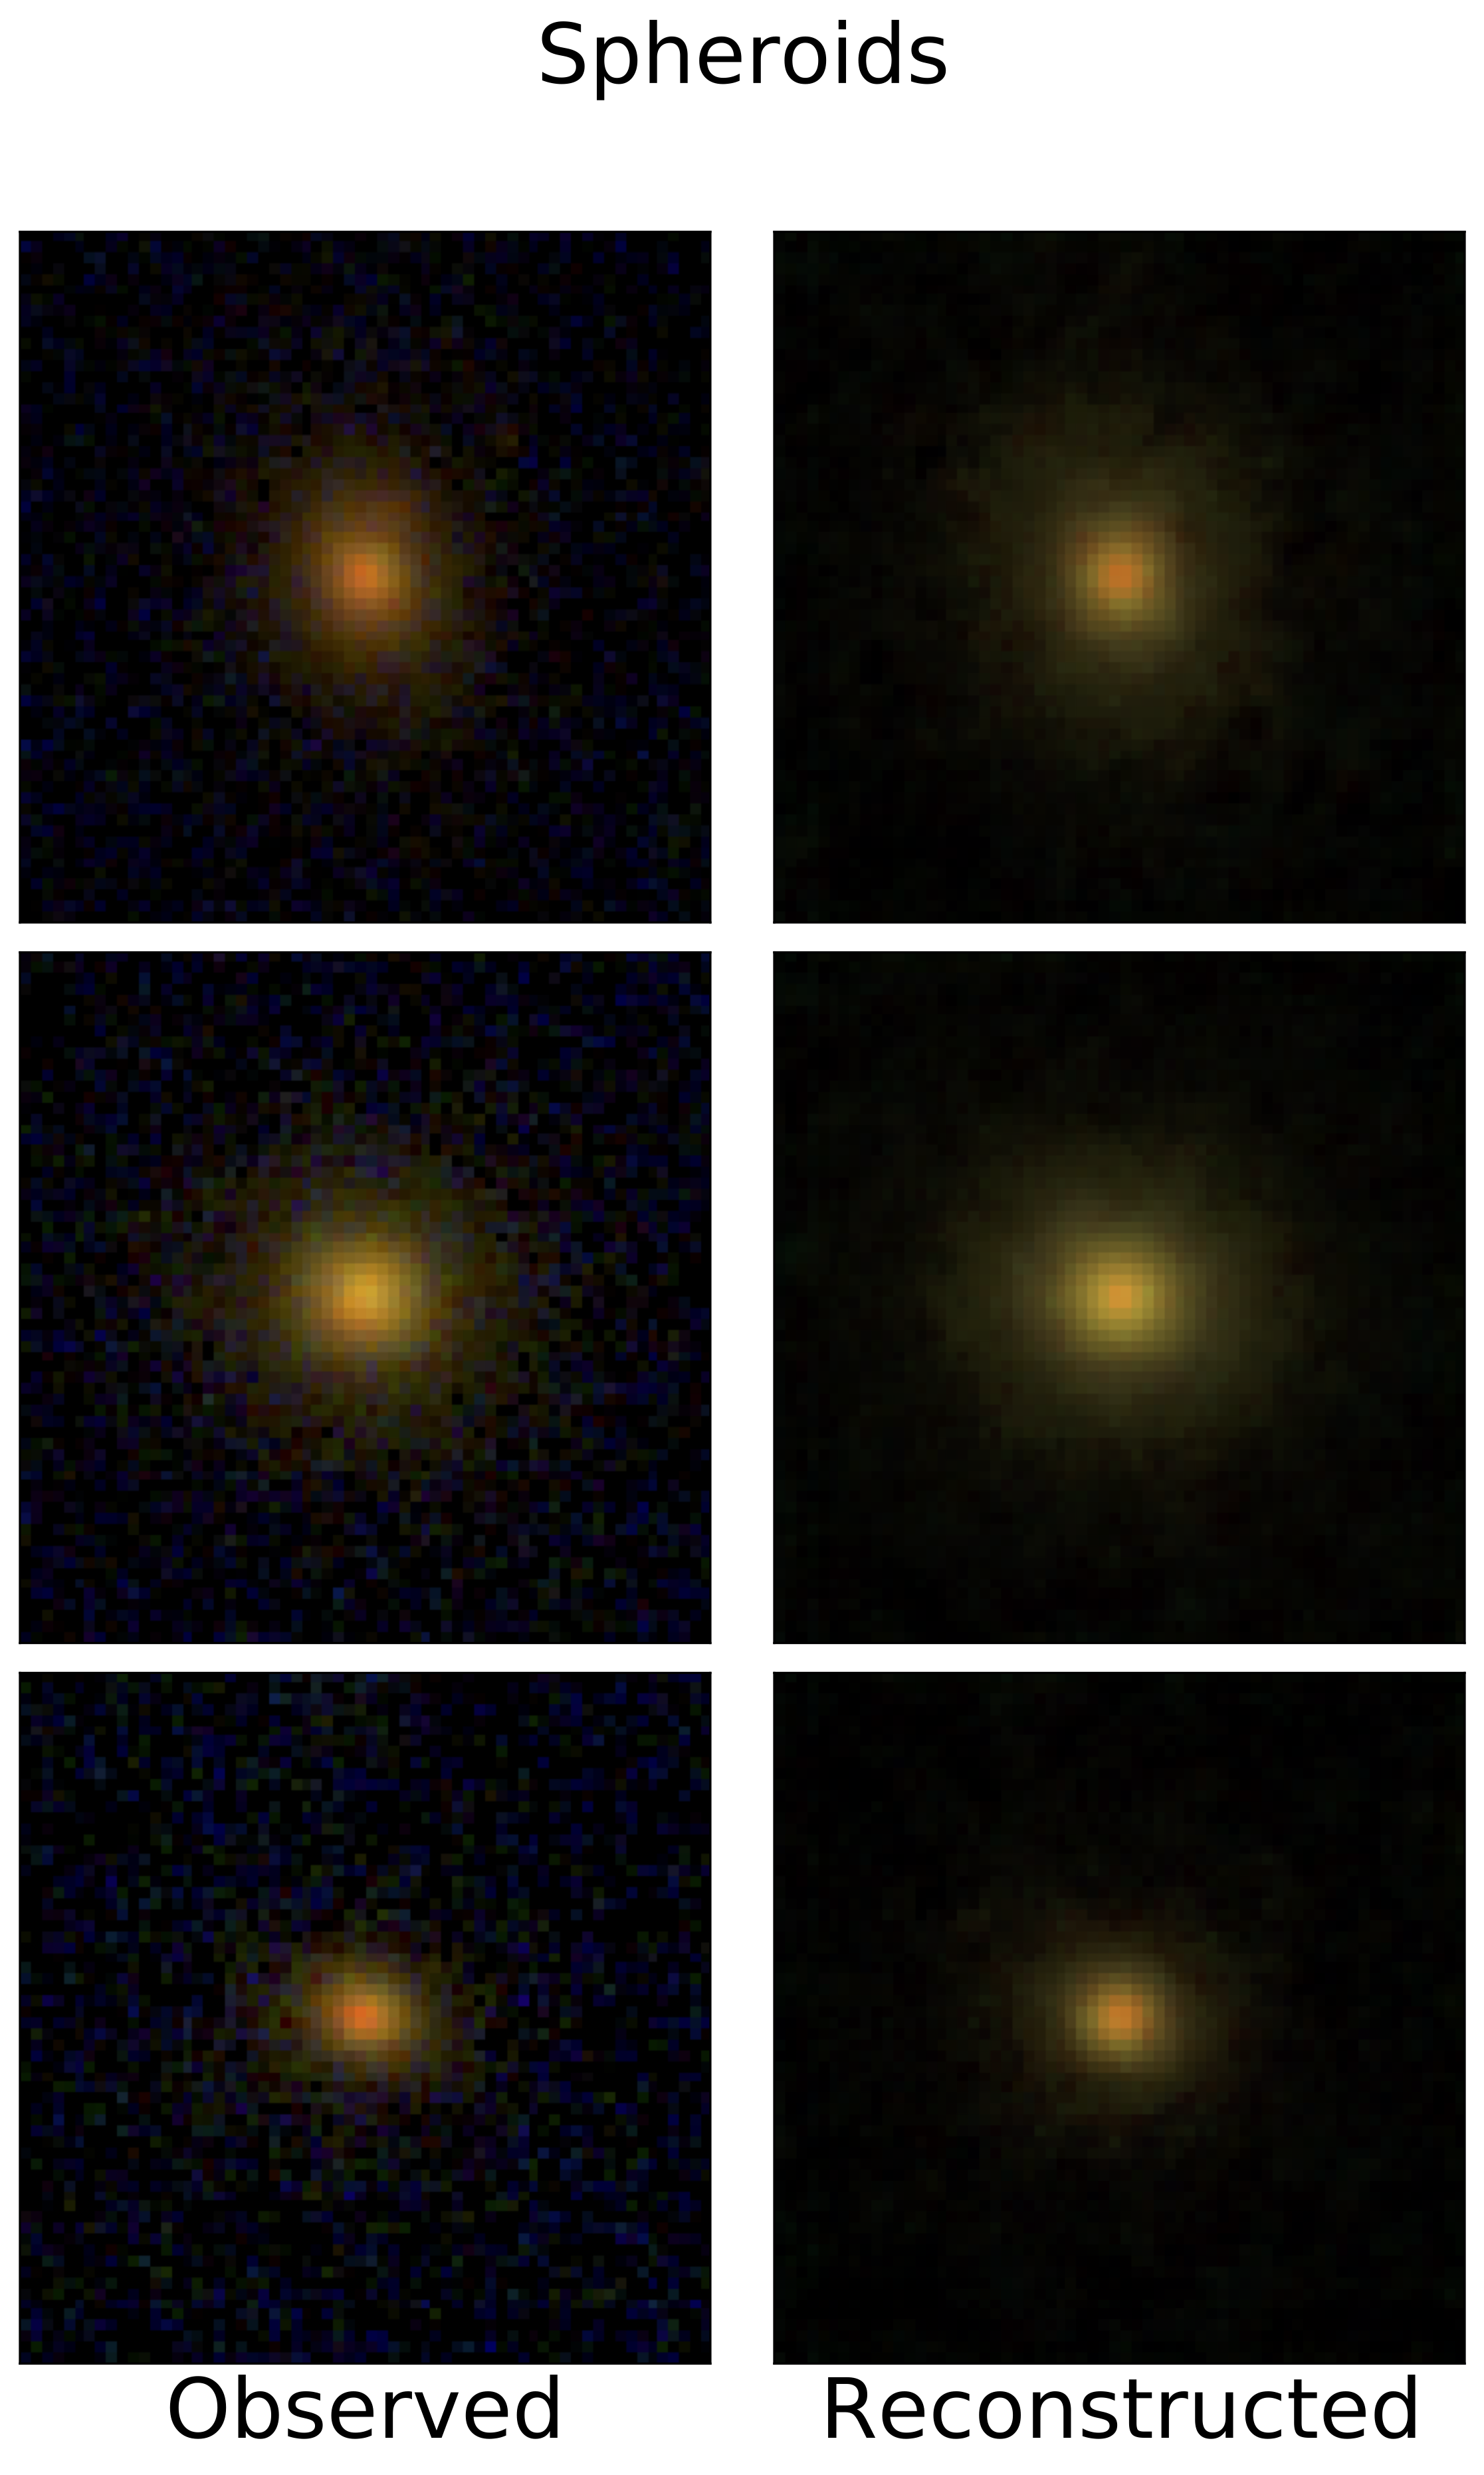
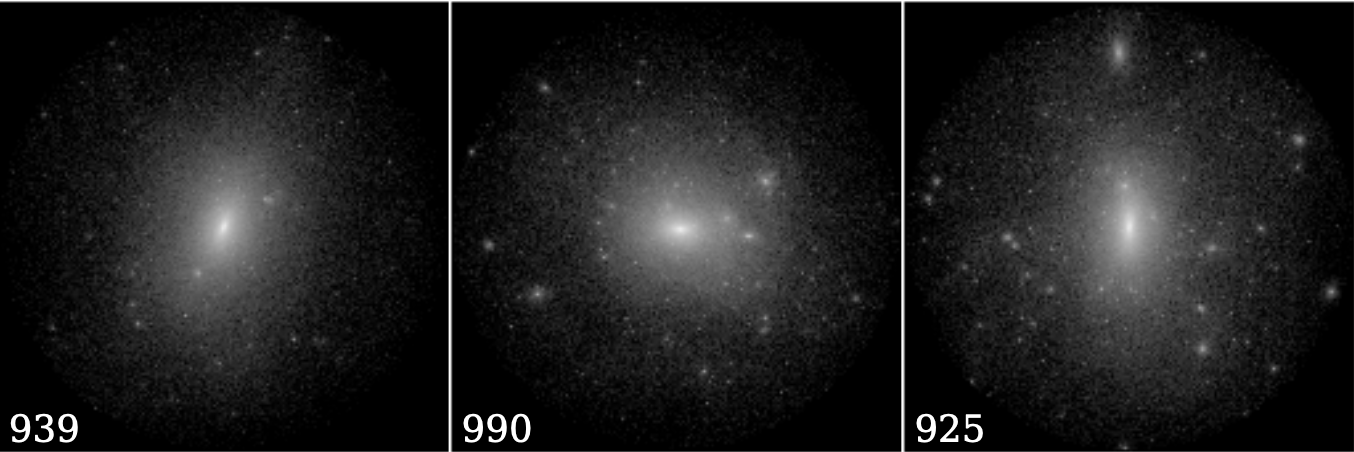
Reconstructed Images
Dey, Andrews, Newman, et al. (2021)
Target Data Sets
- SDSS: low redshift (z < 0.4) photo-z testbed
(Dey, Andrews, Newman, et al. 2021) - ~500,000 galaxies with spec-z and spatially-resolved ugriz images
- Complete coverage of color-redshift space
- Galaxy Zoo disk/spheroid classifications
- DESI (Dark Energy Spectroscopic Instrument)
- 1-2 mag deeper than SDSS but only 3 bands (grz)
- DESI Bright Galaxy Survey: ~20x spectra of SDSS Main Galaxy Sample
- 5 year survey started in 2021
SDSS DR12 Photo-z's
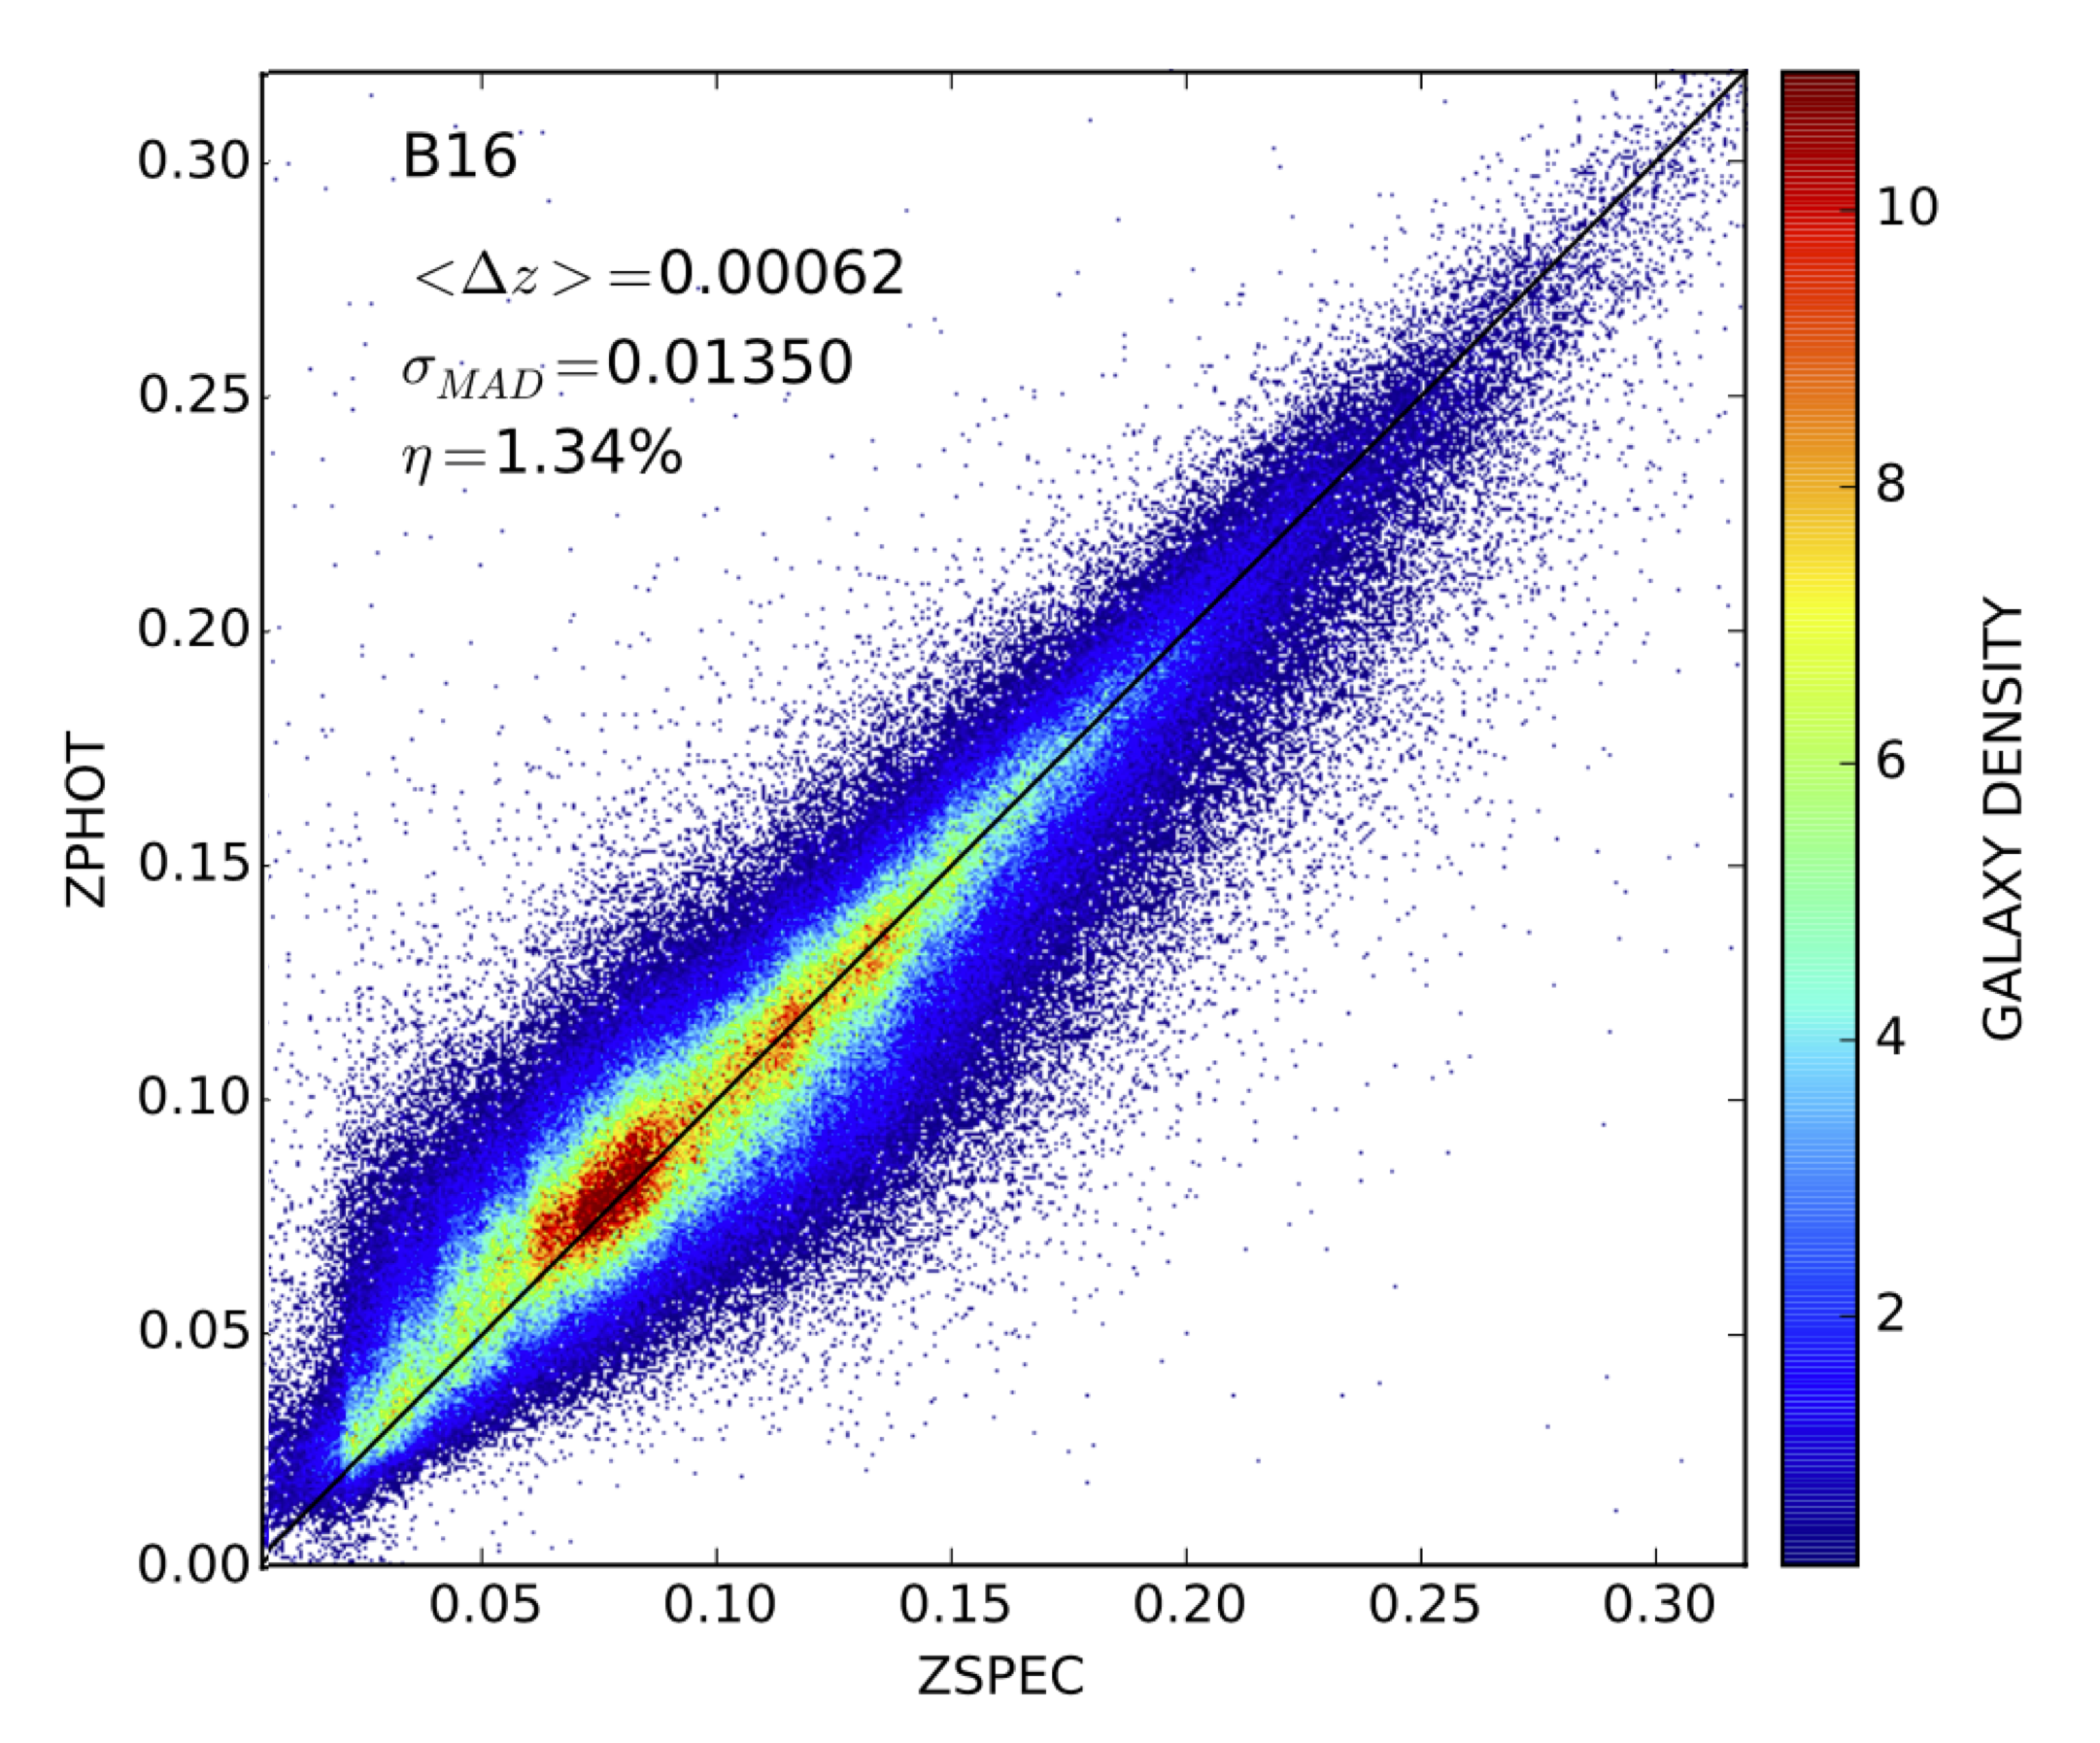
Beck et al. (2016)
(Fig. from Pasquet et al. 2019)
CapsNet Photo-z's
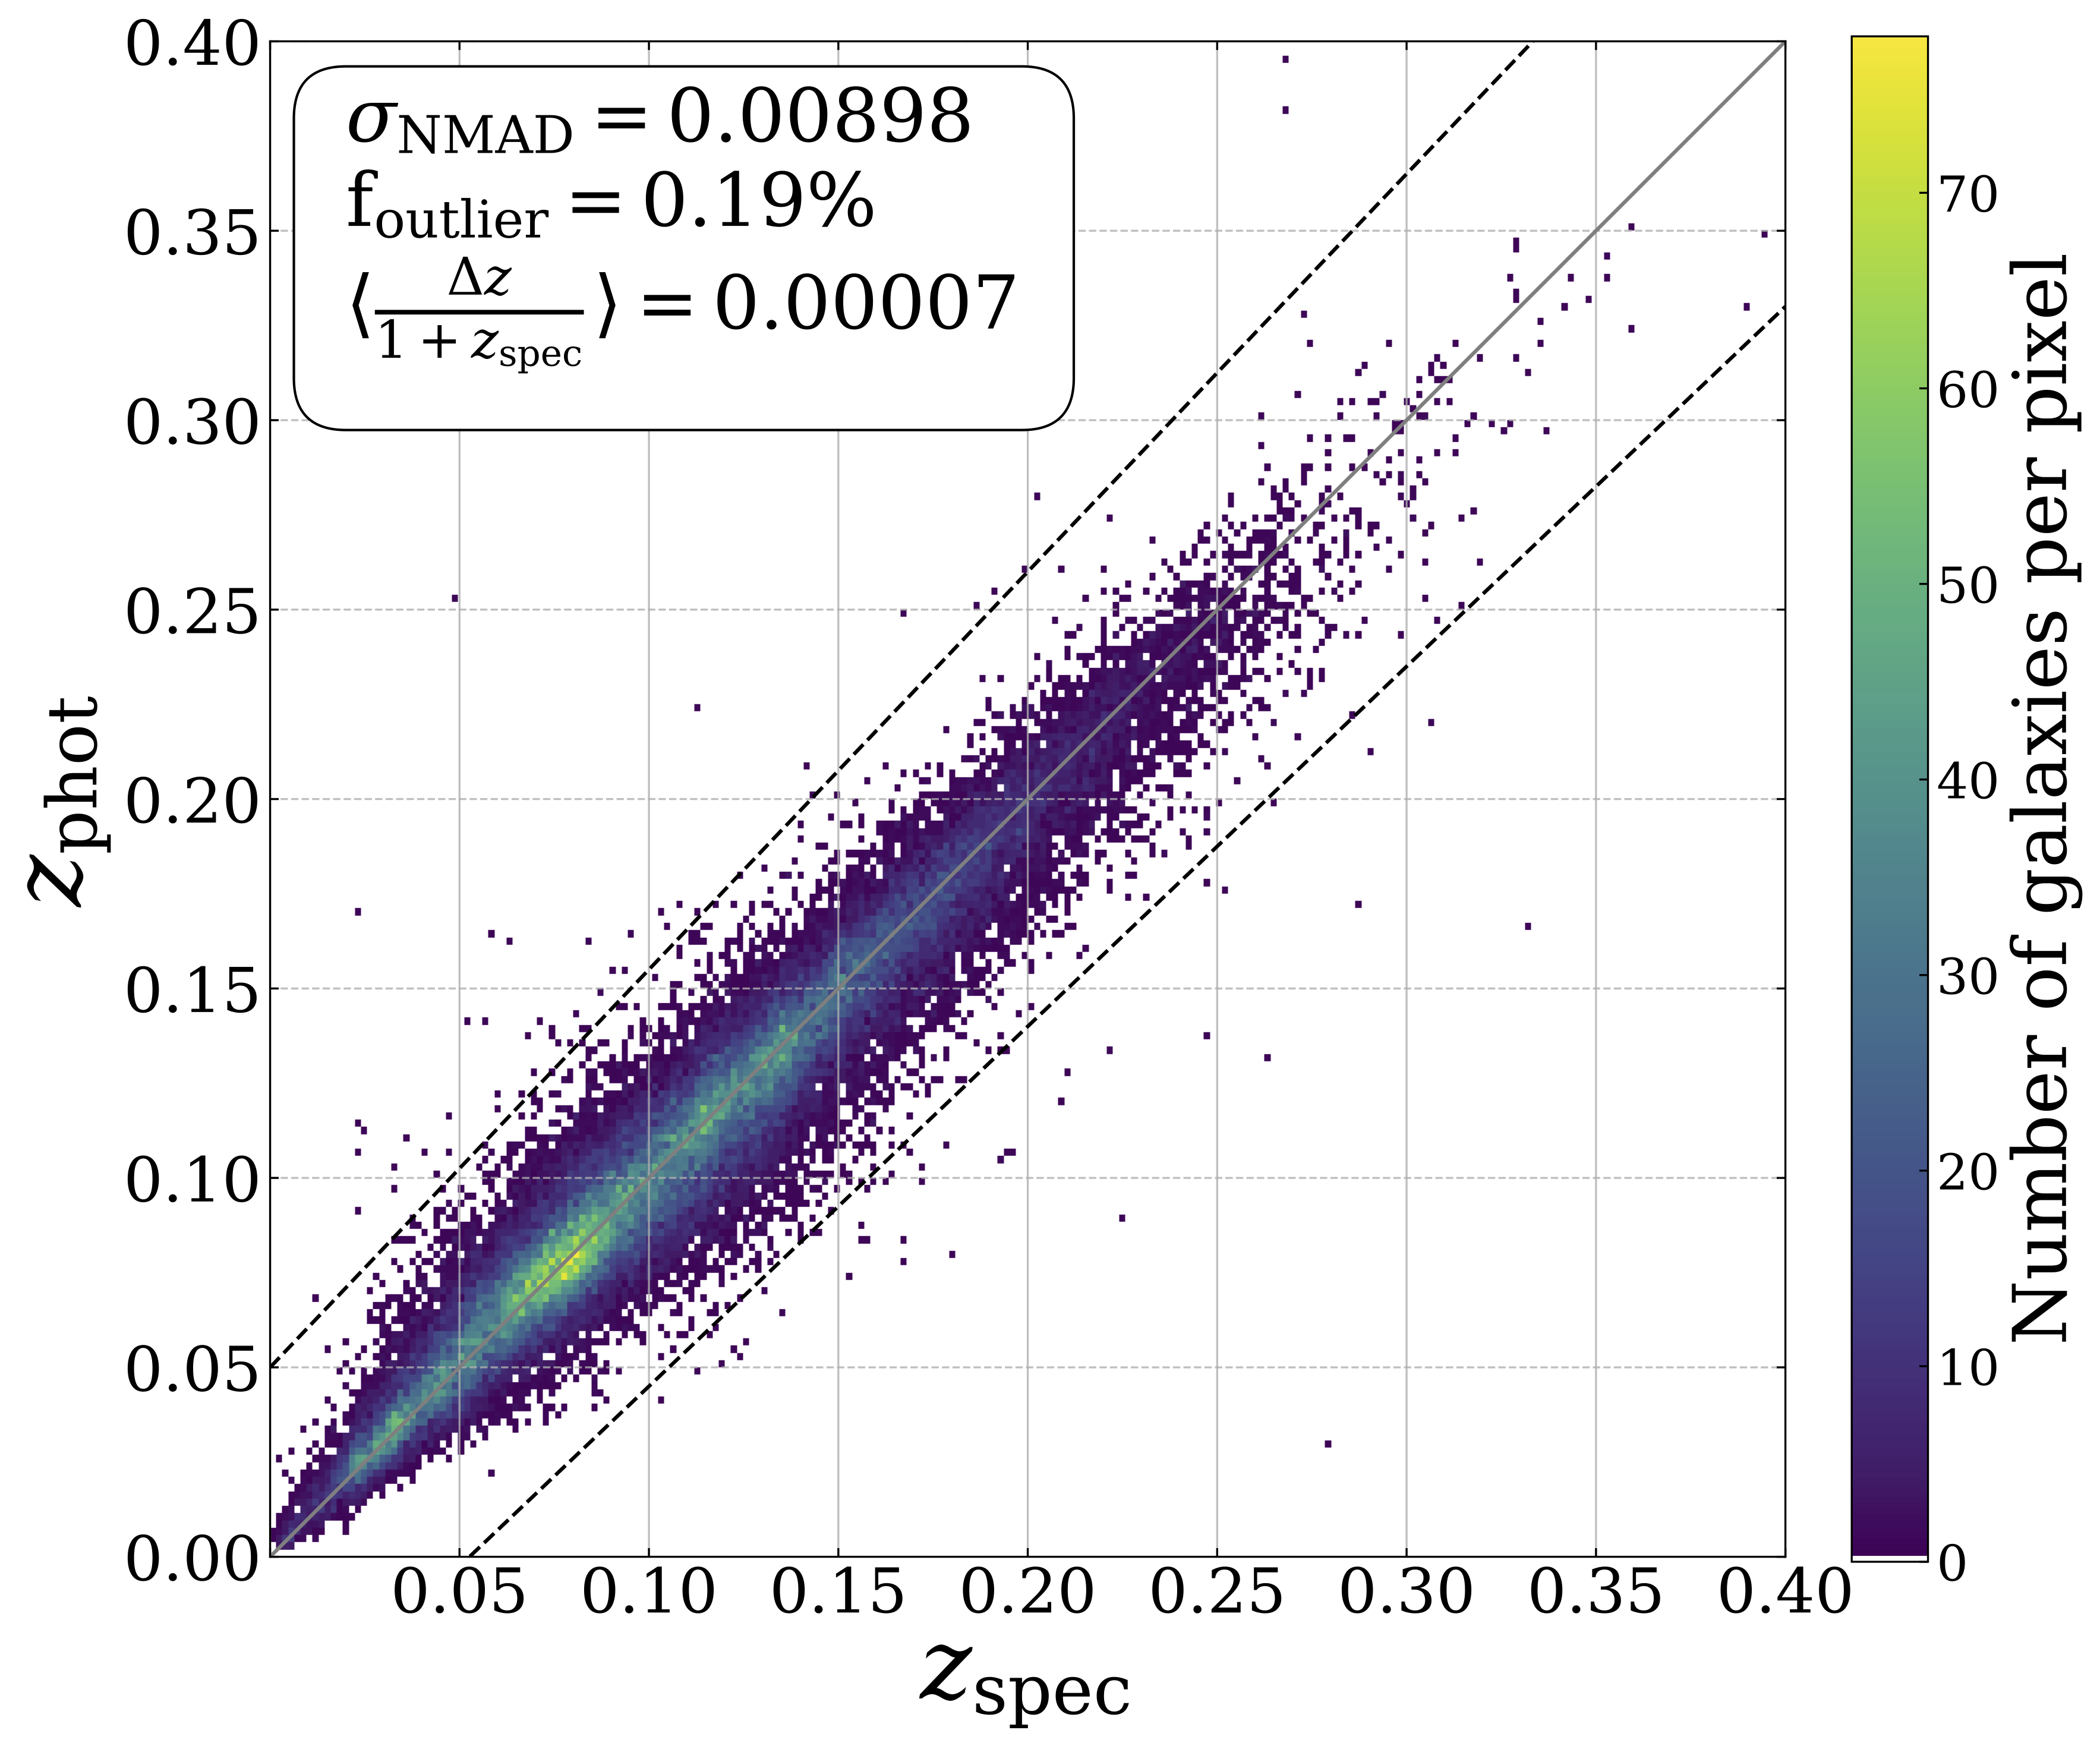
- State-of-the-art outlier fraction.
- Scatter (σNMAD) is competitive with other deep learning methods.
- Unbiased with respect to magnitude
- Excellent performance at very low redshift
(z < 0.05)
Dey, Andrews, Newman, et al. (2021)
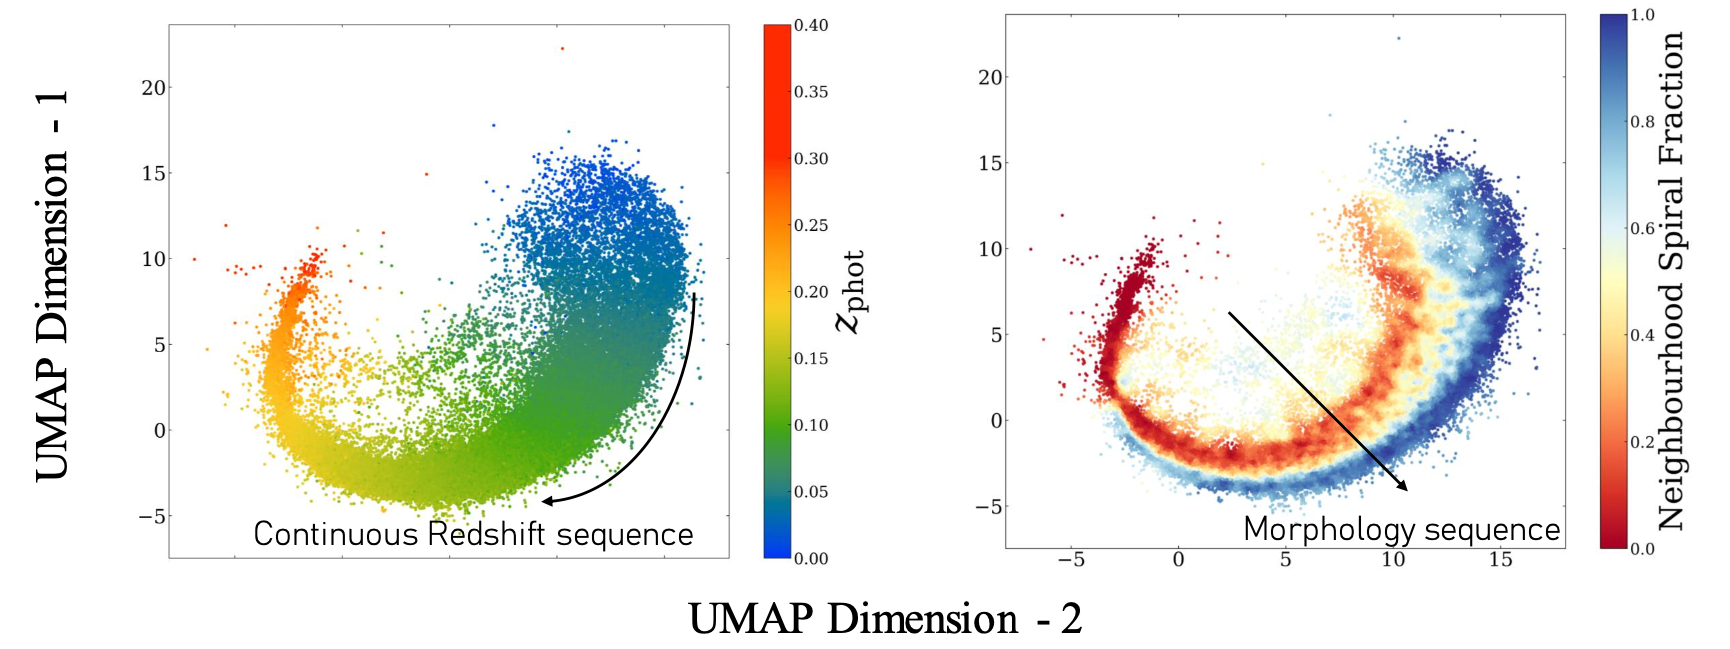
Capsules Encode Physical Properties
- Single redshift sequence (one parameter family)
- Roughly orthagonal morphology direction
Dey, Andrews, Newman, et al. (2021)
Early DESI science with Photo-z's
- Dark matter subhalo abundance (traced by satellite galaxies) is a reliable tracer of dark matter assembly history.
- Simulations with different formation times (Mao et al. 2015):
- But it is difficult to associate faint satellites with their central.
- Are there any more readily accessible galaxy properties (other than mass) that trace assembly history?
Does disk scale length encode assembly history?
- Observationally: the Milky Way has both an abnormally short disk scale length and a quiescent merger history in the last 10 Gyr.
- Analytic theory: classic disk formation models predict that disk scale length is controlled by the spin parameter (Mo et al. 1998).
- Simulations: hydrodynamical simulations find that disk scale length is determined by dark matter halo concentration (Jiang et al. 2018).
Testing Disk Scale Length as a Tracer of Halo Assembly History
- Measuring disk scale length is straightforward (making it a useful potential tracer of assembly history)
- Bottleneck: need redshifts to associate satellite galaxies to their central galaxy.
- Costly with spec-z's! The SAGA Survey obtained ~50,000 spectra to identify 365 satellites around 102 Milky Way-mass galaxies.
- Can we test this hypothesis statistically using a much larger number of galaxies but less accurate redshifts (i.e., photo-z's)?
Complementary to SAGA Survey
- SAGA can confidently match satellites and centrals to probe the full system of each central.
- Our efforts will have 2-3x constraining power but in a statistical sense.
- Our work will expand the scope from just MW-mass galaxies to a wide mass range of disk galaxies.
Very low-z (z < 0.01) photo-z's are suprisingly difficult
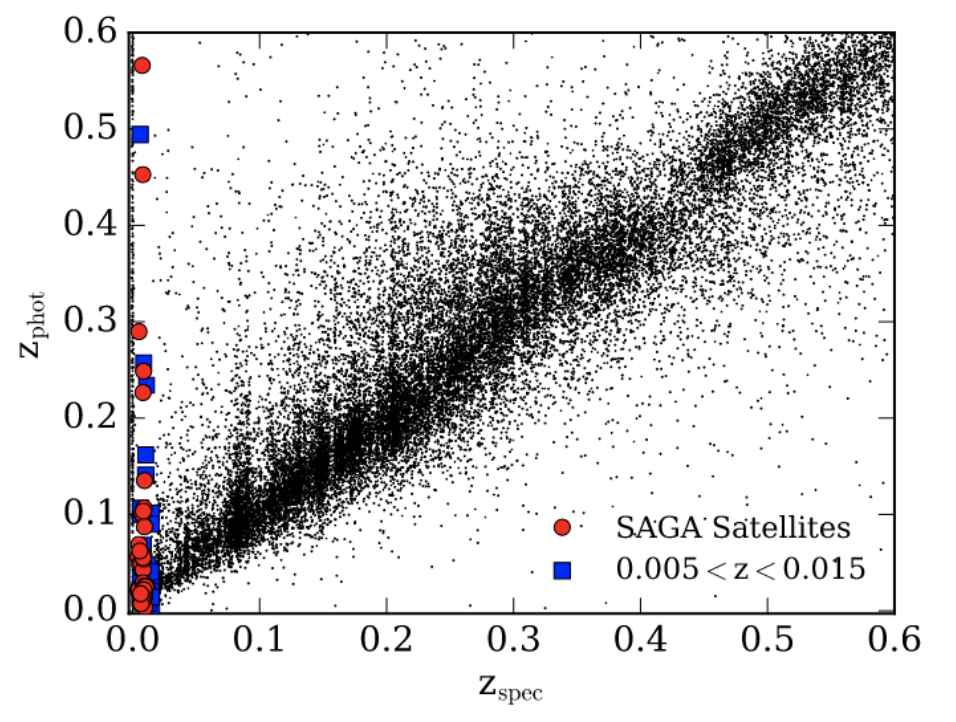
Geha et al. (2017)
- Training data is sparse and not representative:
- Very little volume at low-z.
- The brighter galaxies (centrals) are not representative of the fainter galaxies (satellites).
- Attenuation bias:
- Machine learning methods optimize for the more common higher redshift objects.
- Asymmetric bound at z = 0.
Exploit Size/Morphology with CapsNets
- CapsNets: unbiased and accurate even at very low-z and faint magnitudes.
- Train CapsNet using DESI spec-z's (which go fainter than SDSS spec-z's).
- Estimate photo-z's of galaxies near bright very low-z central galaxies (w/ SDSS spec-z's)
- Do central galaxies with shorter disk scale lengths have more satellites?
Photo-z's for cosmology
Recalibrating Photo-z PDFs
- Optimized CANDELS Photo-z's
- Kodra, Andrews, Newman, et al. (submitted to ApJ)
- Local Recalibration of Photo-z PDFs Using Feature Space Regression
- Dey, Newman, Andrews, et al. (2021)
- Dey, Zhao, Newman, Andrews, et al. (submitted)
- Could be key for achieving weak lensing photo-z requirements.
- Preliminary plans for including in the LSST Dark Energy Science Collaboration photo-z pipeline.
Conclusions
- Constructing the Milky Way's UV-to-IR Spectral Energy Distribution with Gaussian Processes
- Estimating the Milky Way's supermassive black hole activity
- Achieving state-of-the-art photometric redshifts with deep learning
- Quantifying the uncertainty on photometric redshifts
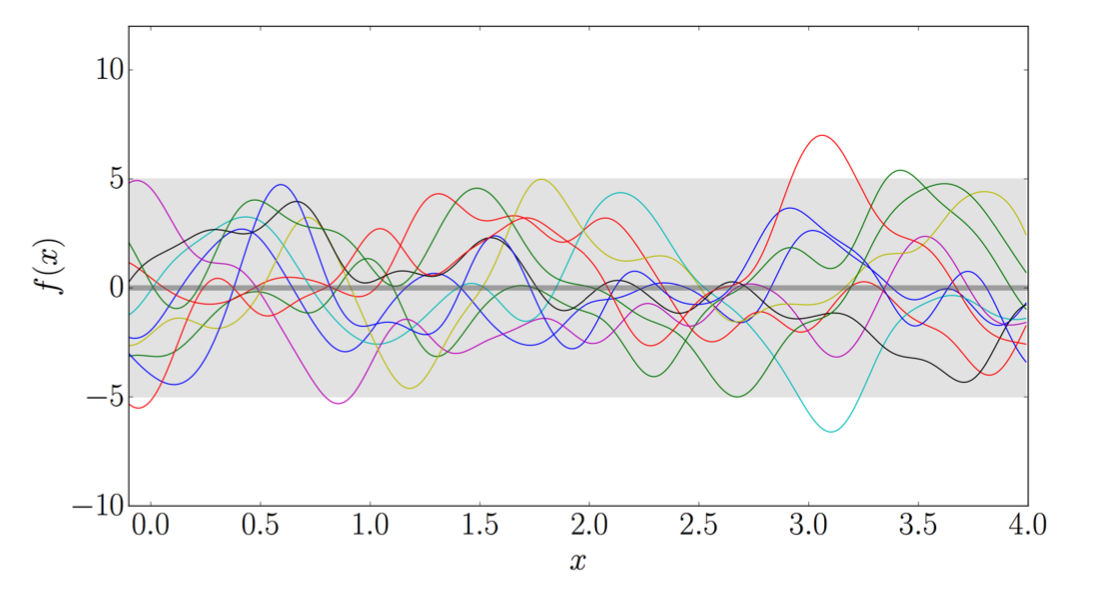
Kernel is key
covariance matrix that constrains the class of functions
Noiseless data
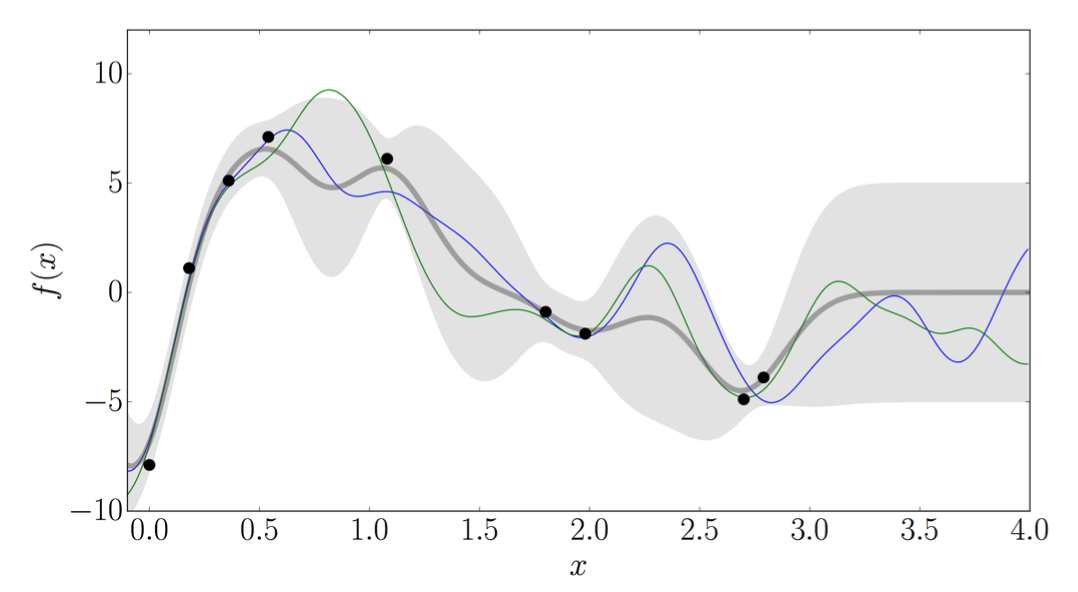
Noisy data
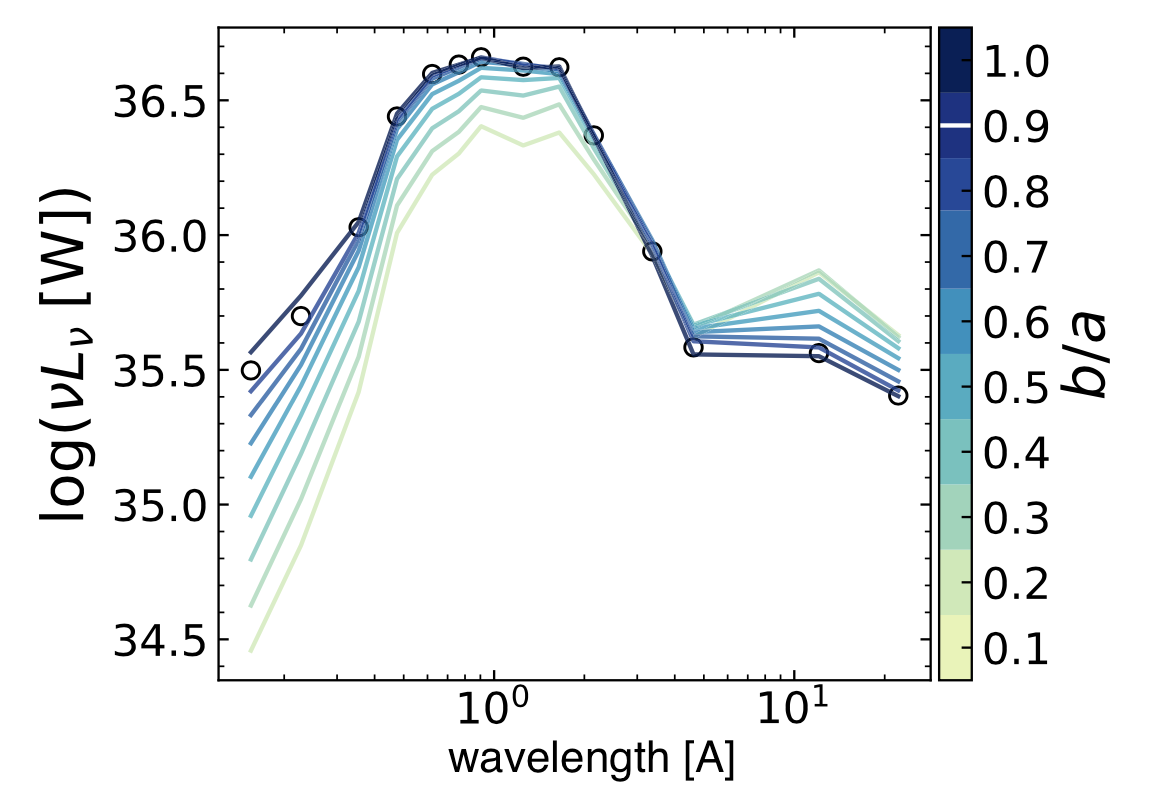
GPR predicts SED variations with inclination
Fielder, Newman, Andrews, et al. (2021)
Data-driven K-corrections
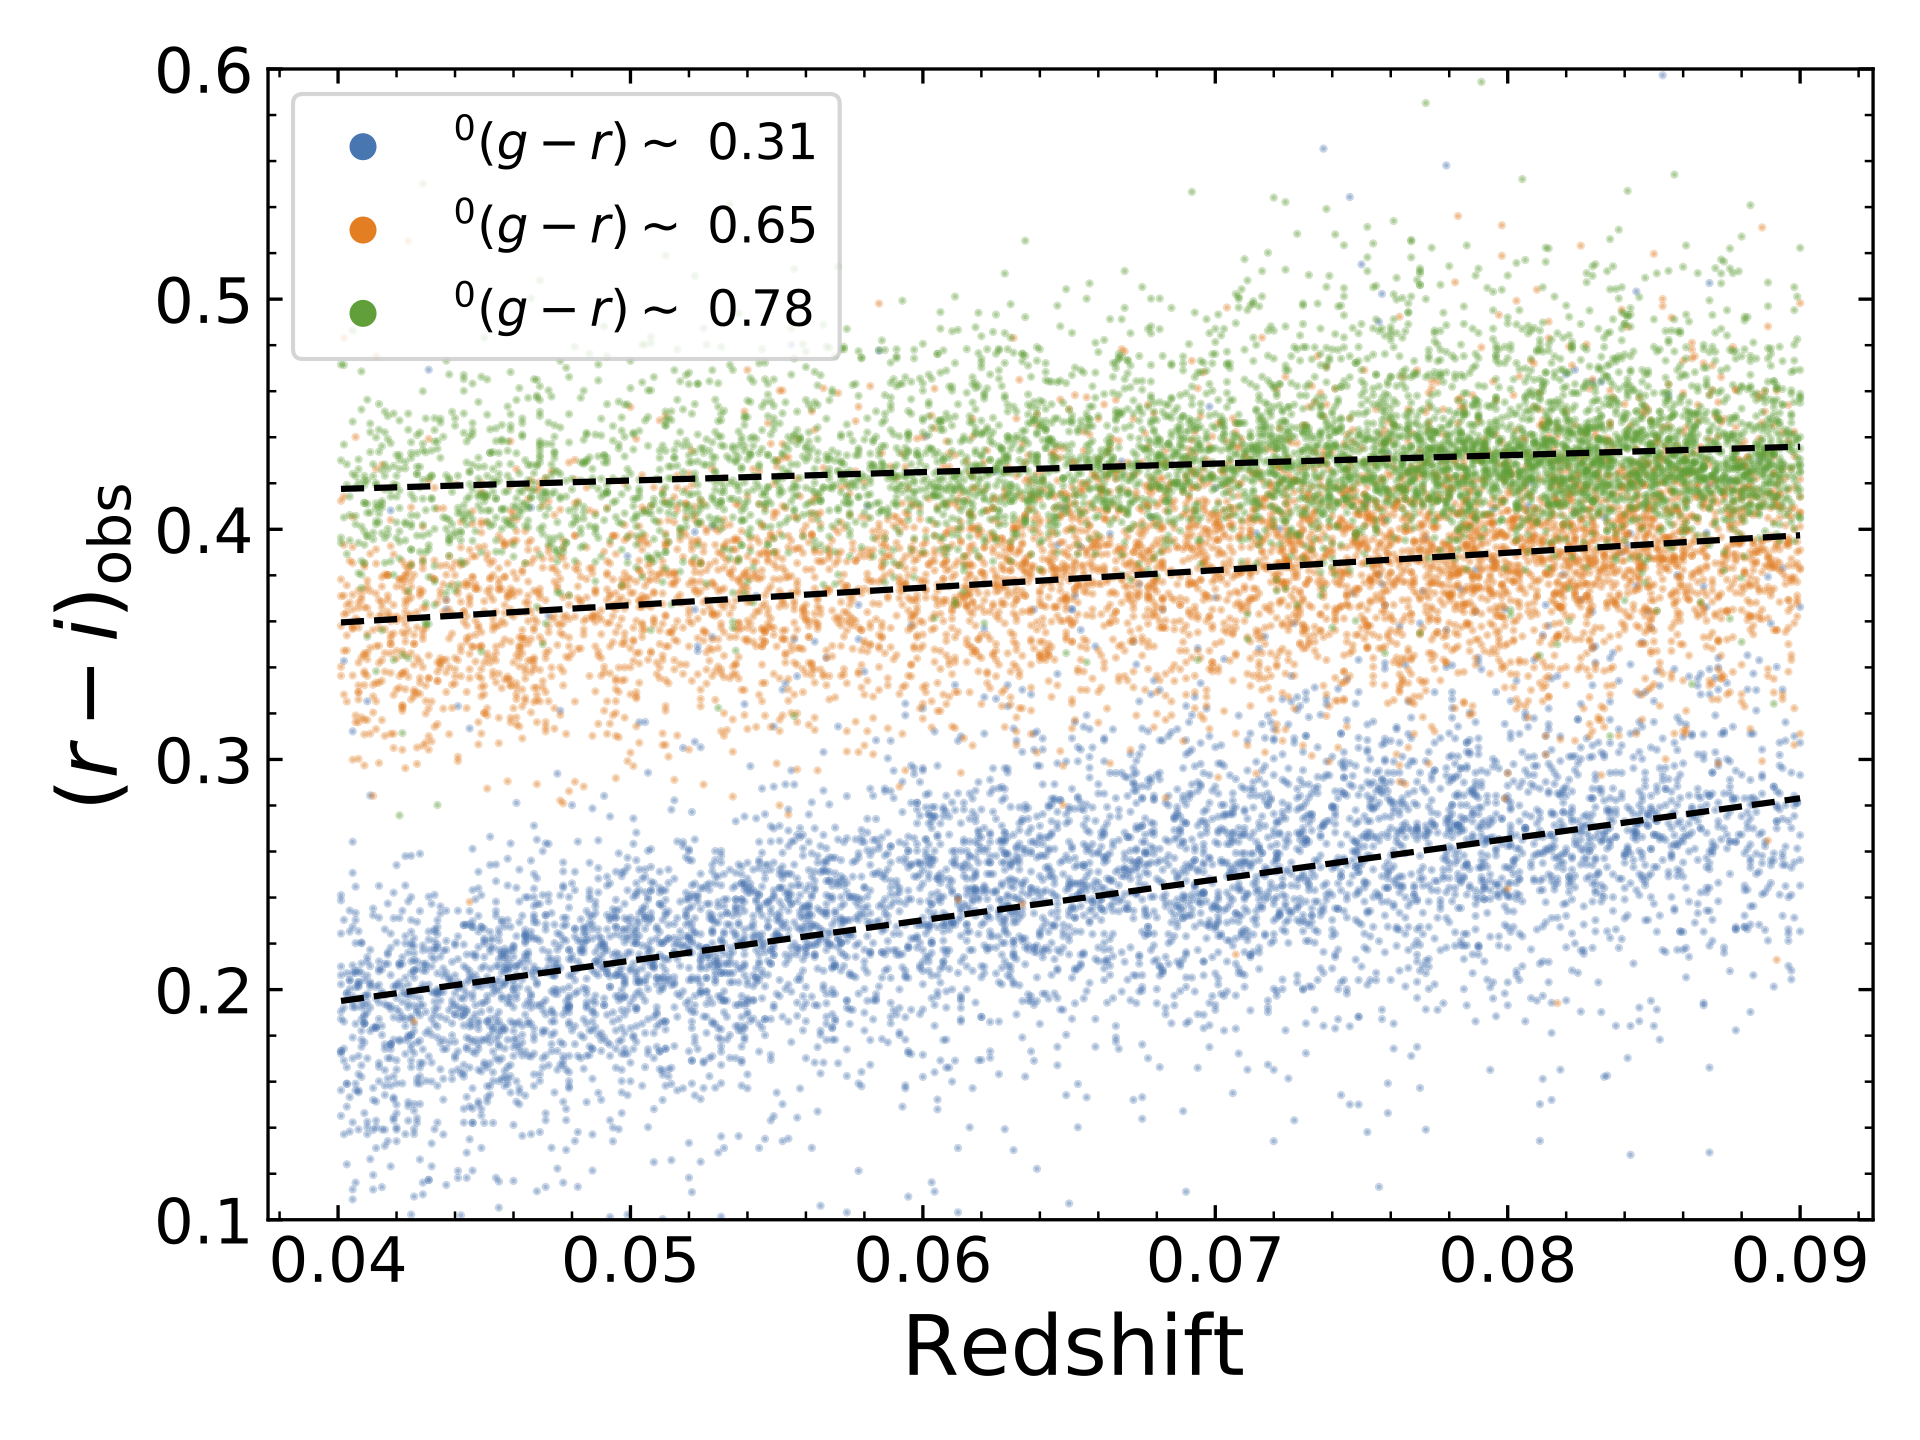
Low redshift galaxy SEDs are a one-parameter family (e.g., Connolly et al. 1995)
Fielder, Andrews, Newman, et al. (in prep.)
Data-driven K-corrections
- Extrapolate down to z=0.
- Galaxies with similar intrinsic g-r color at different redshifts fall in similar locii in color-color space.
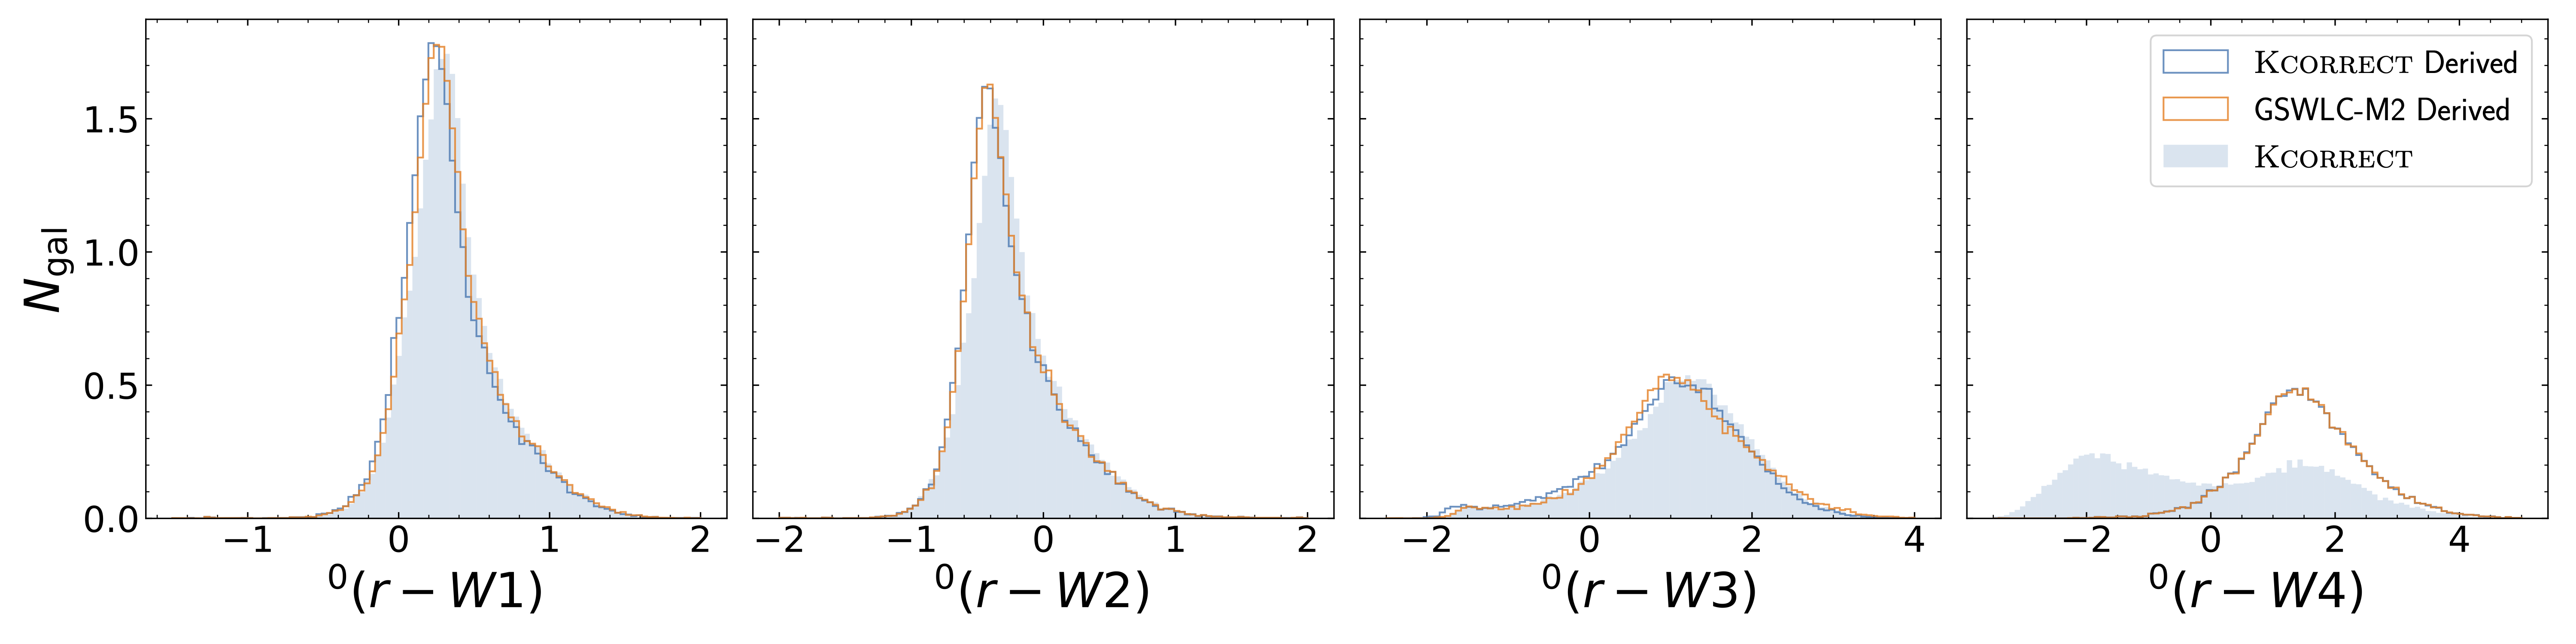
Ta da! K-corrected WISE W4
Fielder, Andrews, Newman, et al. (in prep.)
CapsNets are excellent at estimating redshifts of low mass satellites.
Will CapsNets photo-z estimation work at high-z?
- Community consensus is NO.
- Wider redshift range
- Larger color space
- Spectroscopic incompleteness
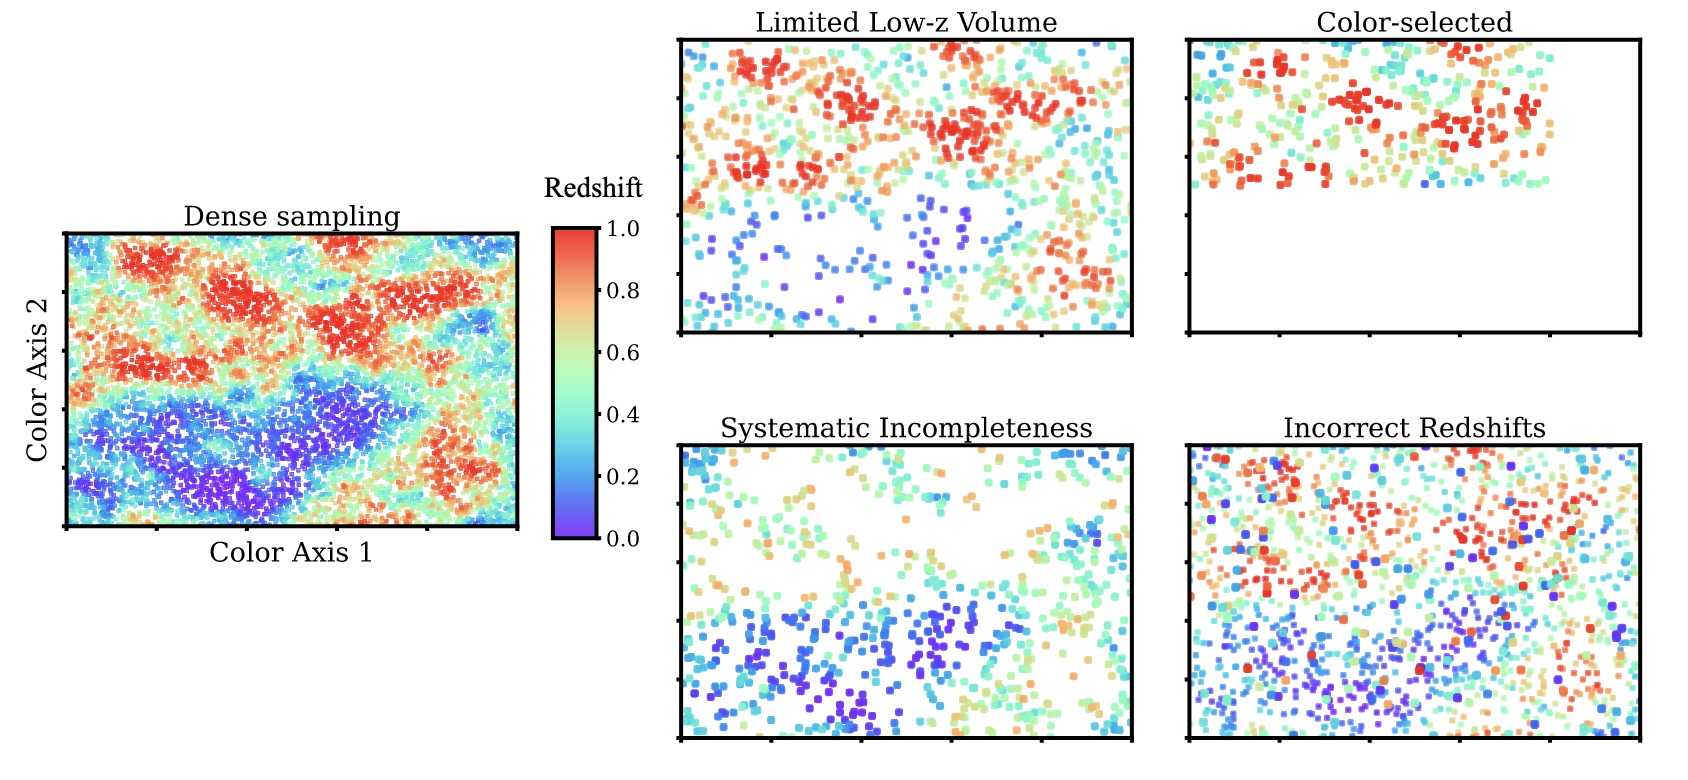
Spectroscopic Incompleteness
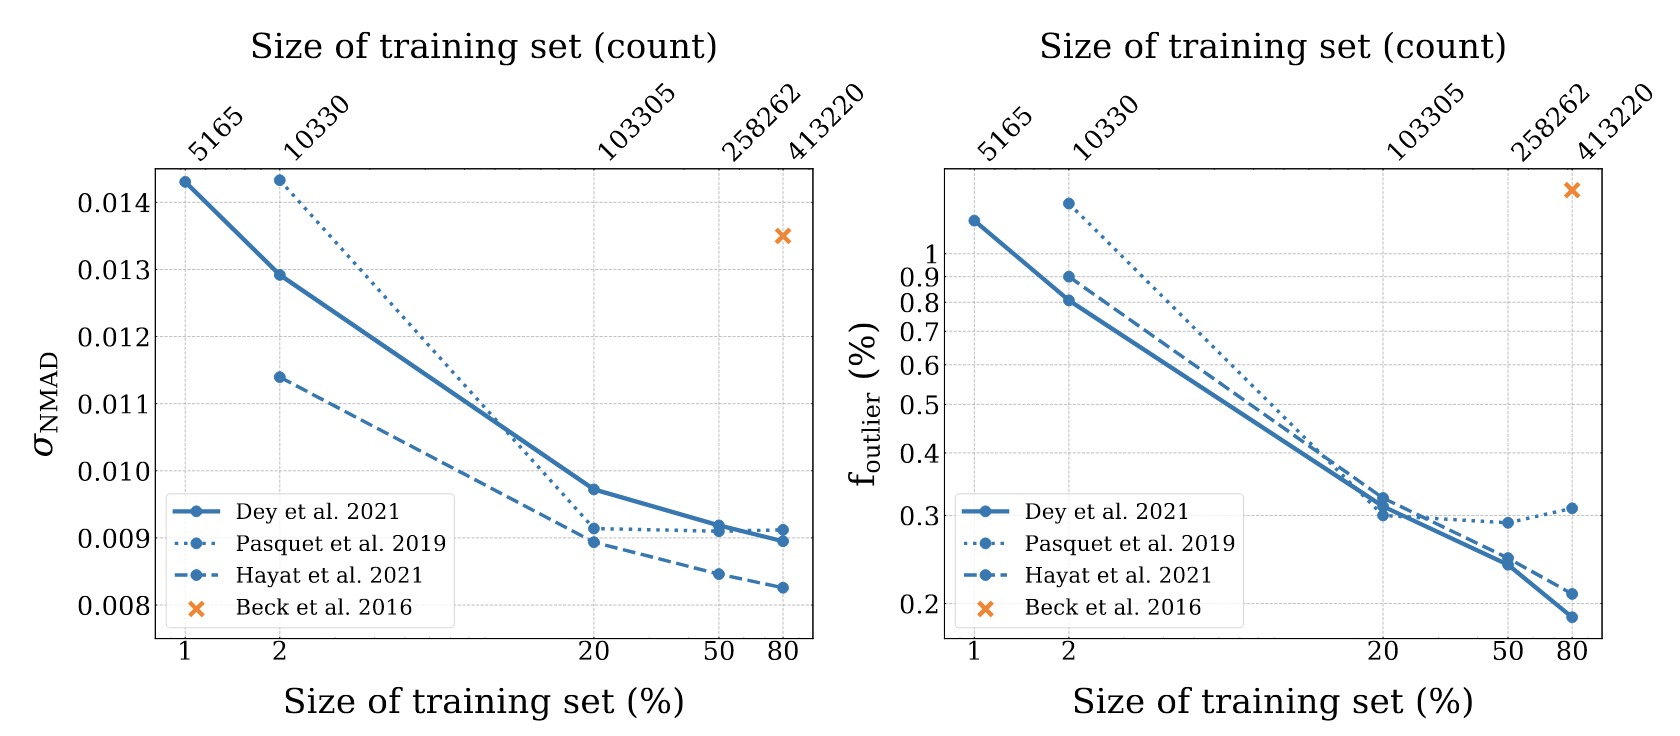
Performance with Training Set size
Dey, Andrews, Newman, et al. (2021)
CapsNet Photo-z's at High-z
- Galaxy morphologies are very different at z > 1.
- Might only need one high-resolution space-based image (e.g., Euclid or Roman) + photometry from other bands (e.g., LSST)
- Nearly independent systematics from template-based methods
- Provide a veto on catastrophic outliers
Prototype: CANDELS CapsNet Photo-z's
- Only 4 optical/NIR HST bands out to z=3 (to span the 4000 A break)
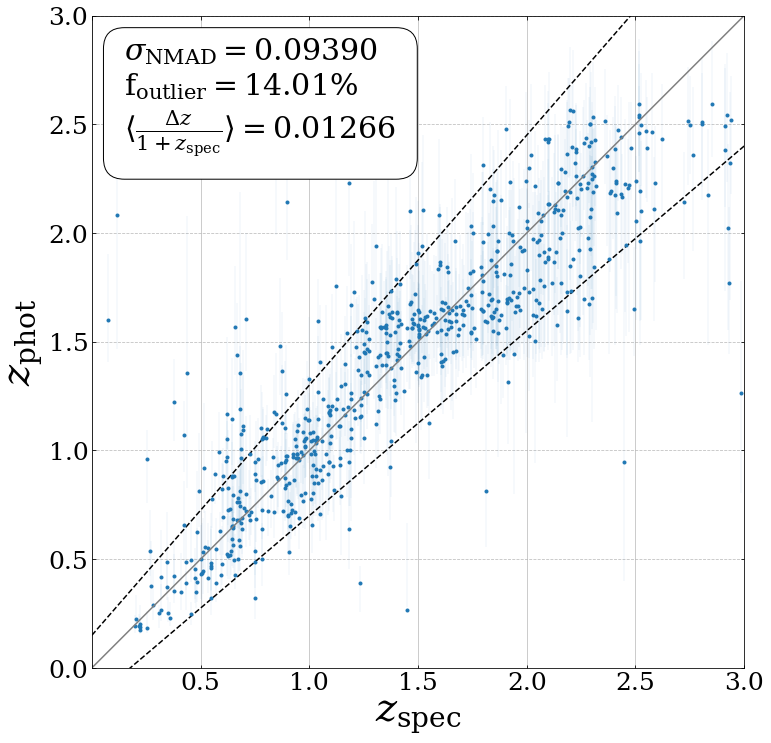
Success!
- ...or at least not totally infeasible.
- Can also leverage many more photometric bands.