Effective Plotting
Brett Andrews
University of Pittsburgh
DESI Collaboration Meeting
12.01.2021
Don't make me think!
Take advantage of human perception.
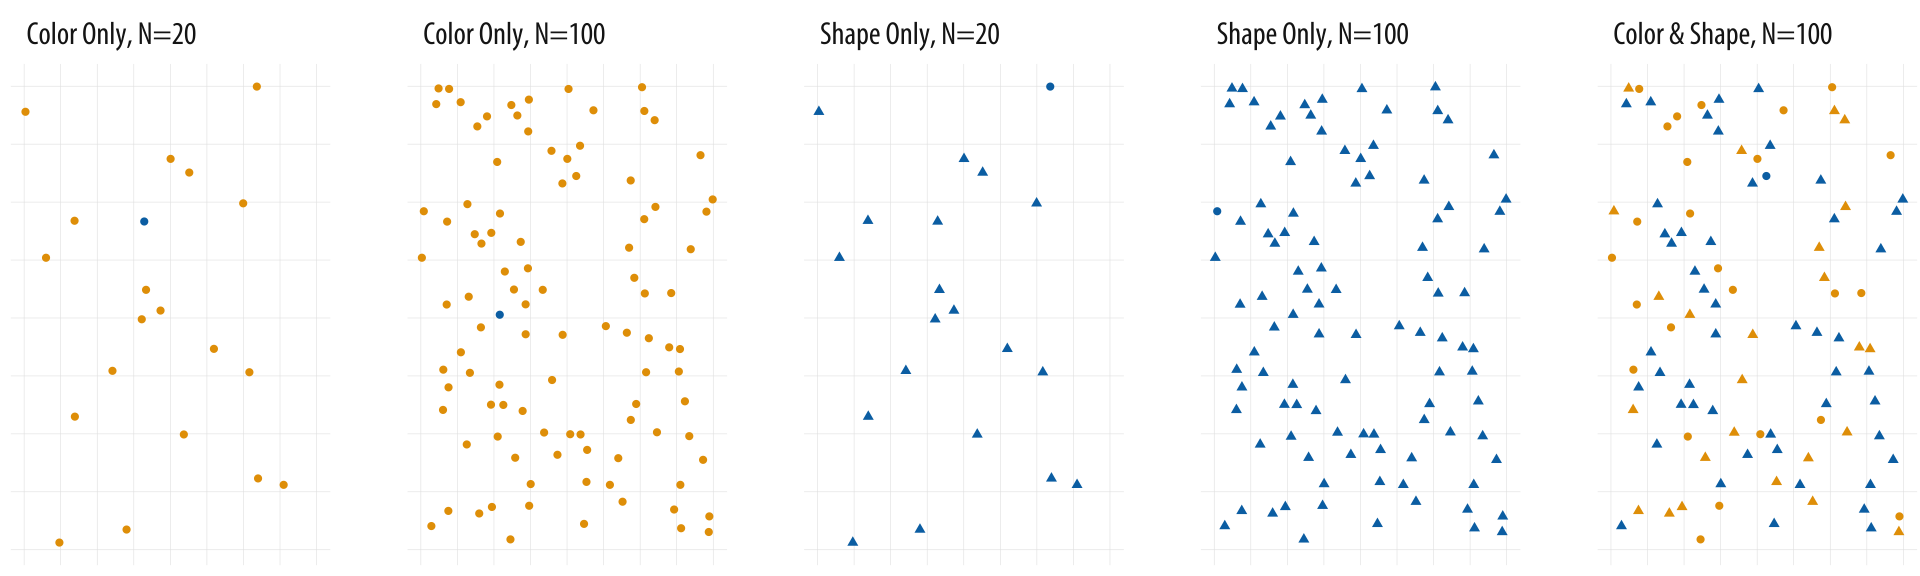
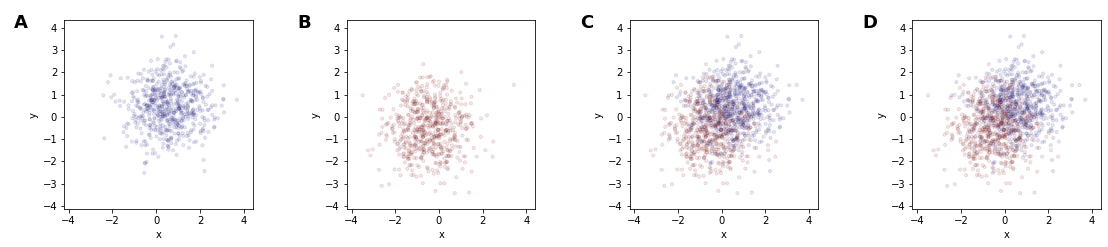
Color better than shape.
Kieran Healy, "Data Vizualization: a Practical Introduction."
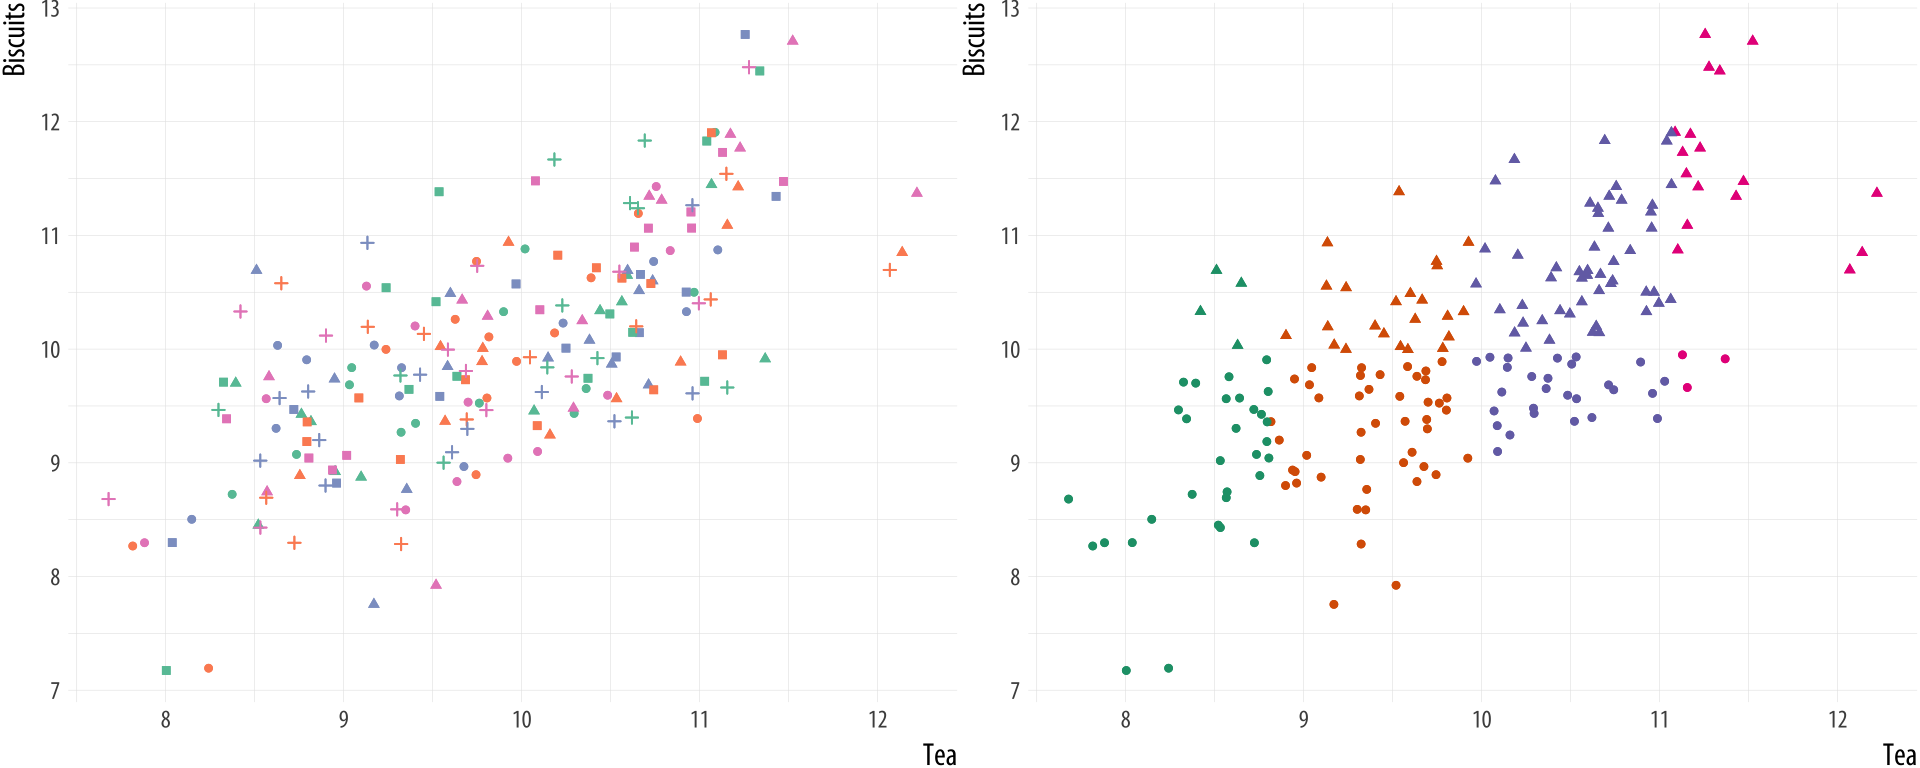
Distinguishability falls off a cliff unless data is highly structured.
Kieran Healy, "Data Vizualization: a Practical Introduction."
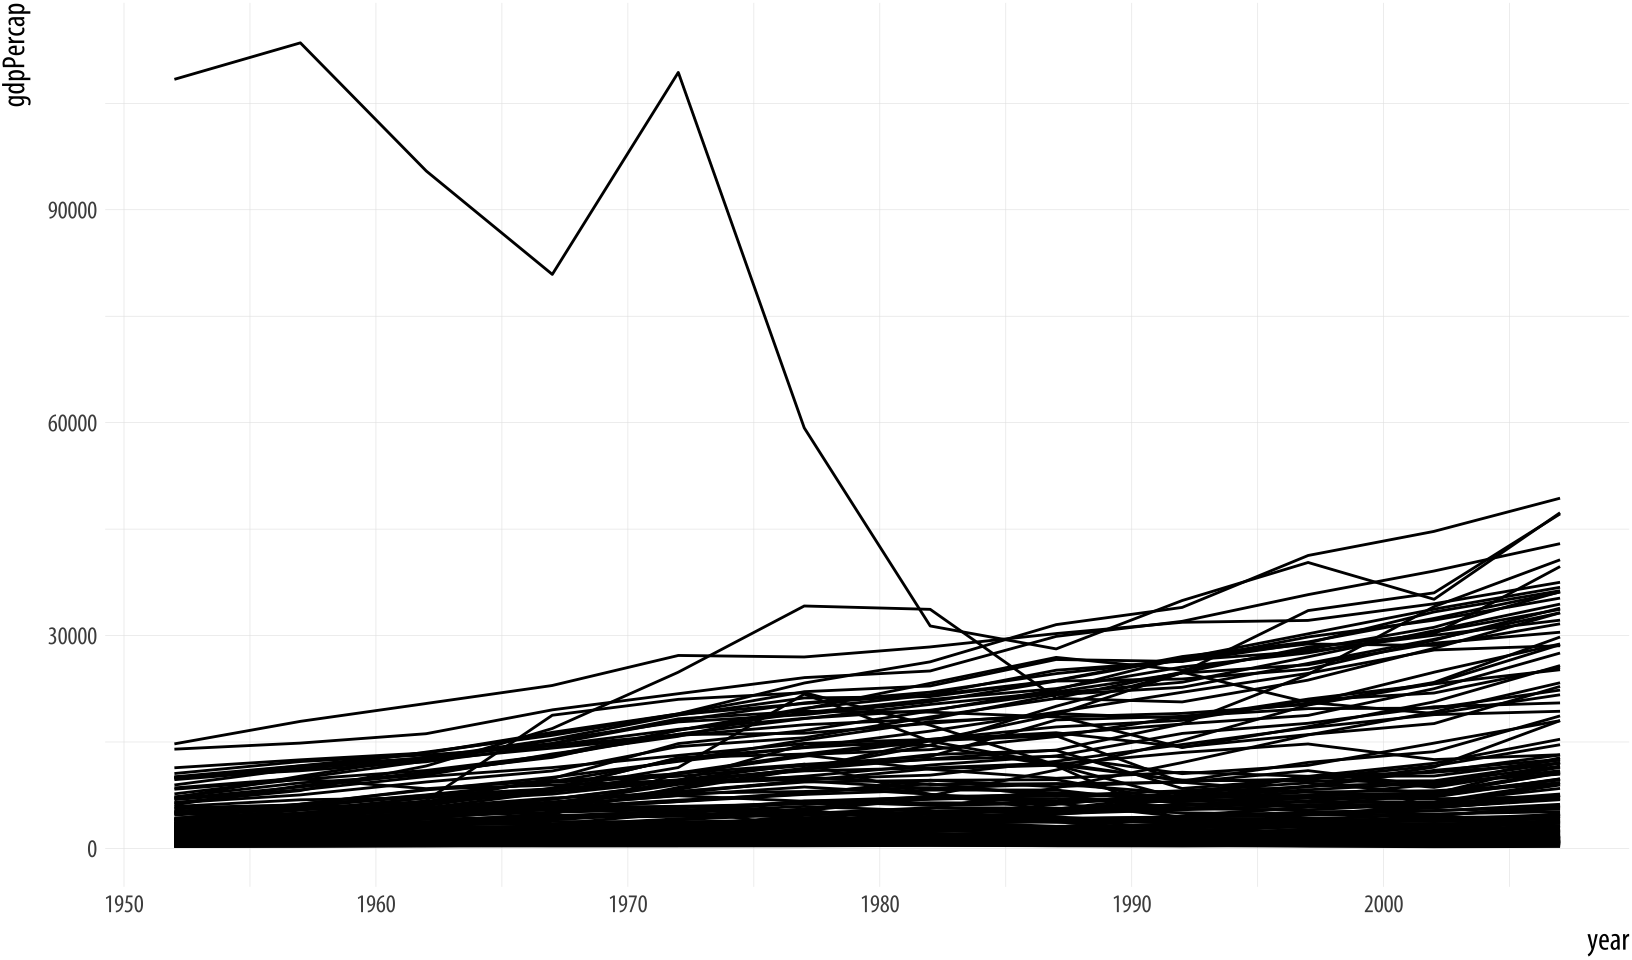
Don't need to show all data in one panel.
Kieran Healy, "Data Vizualization: a Practical Introduction."
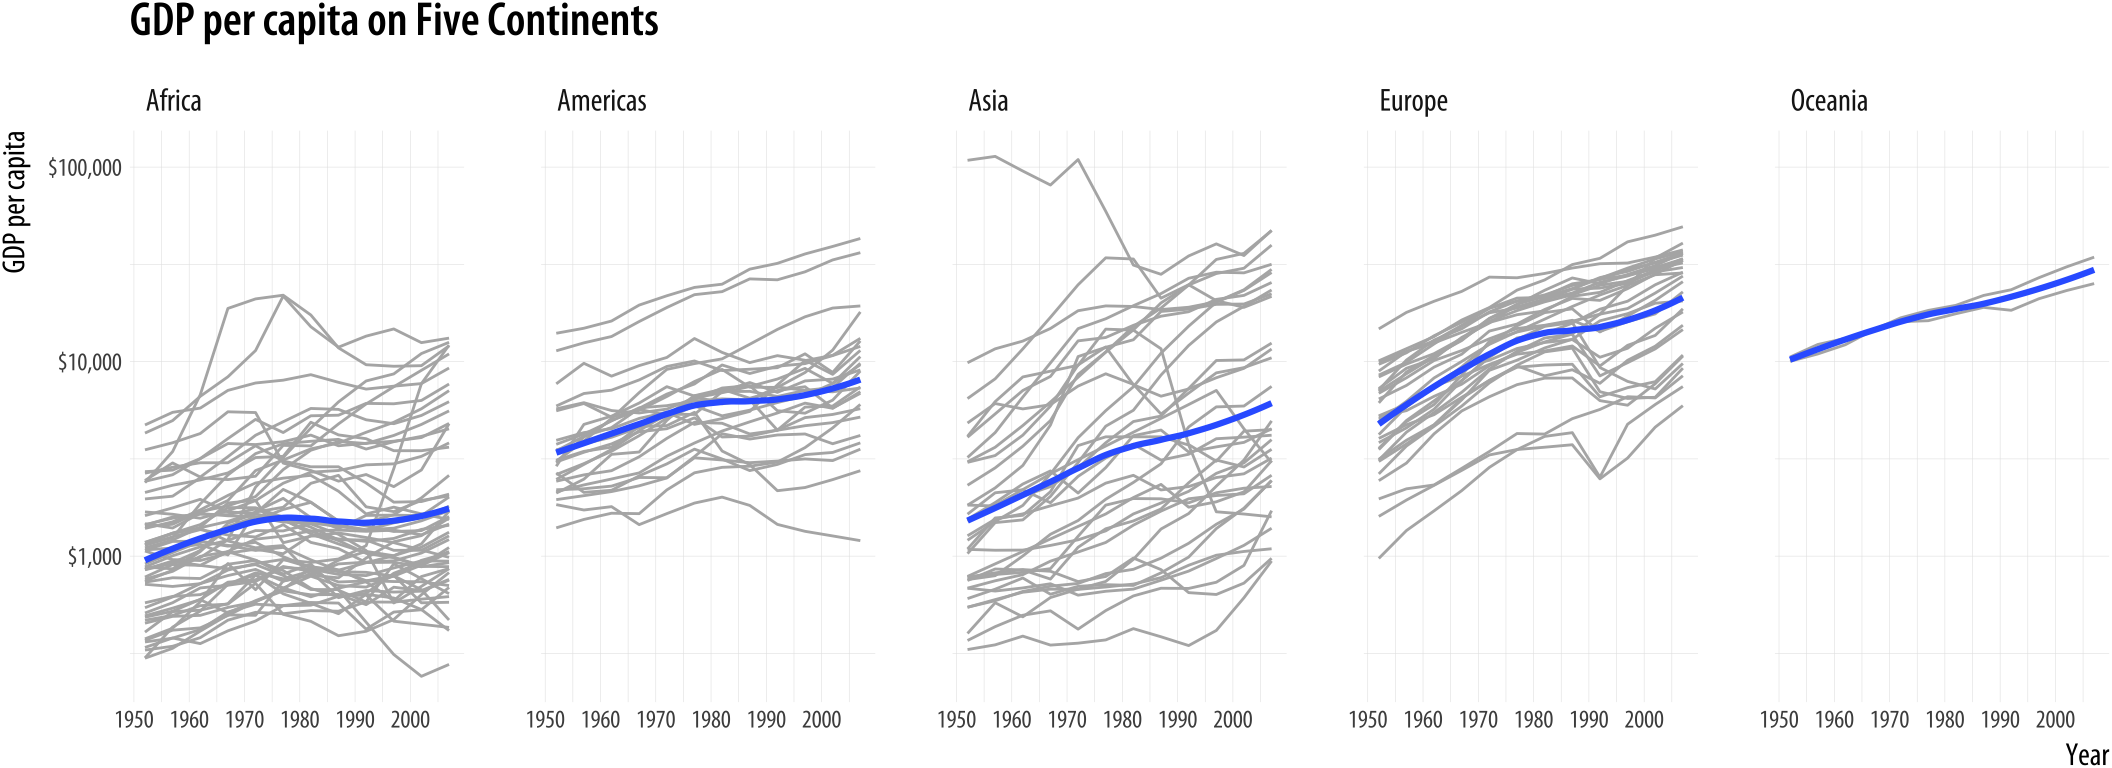
Multiple panels add structure.
Kieran Healy, "Data Vizualization: a Practical Introduction."
Shapes and Colors: some choices are better
Unordered/Qualitative Data
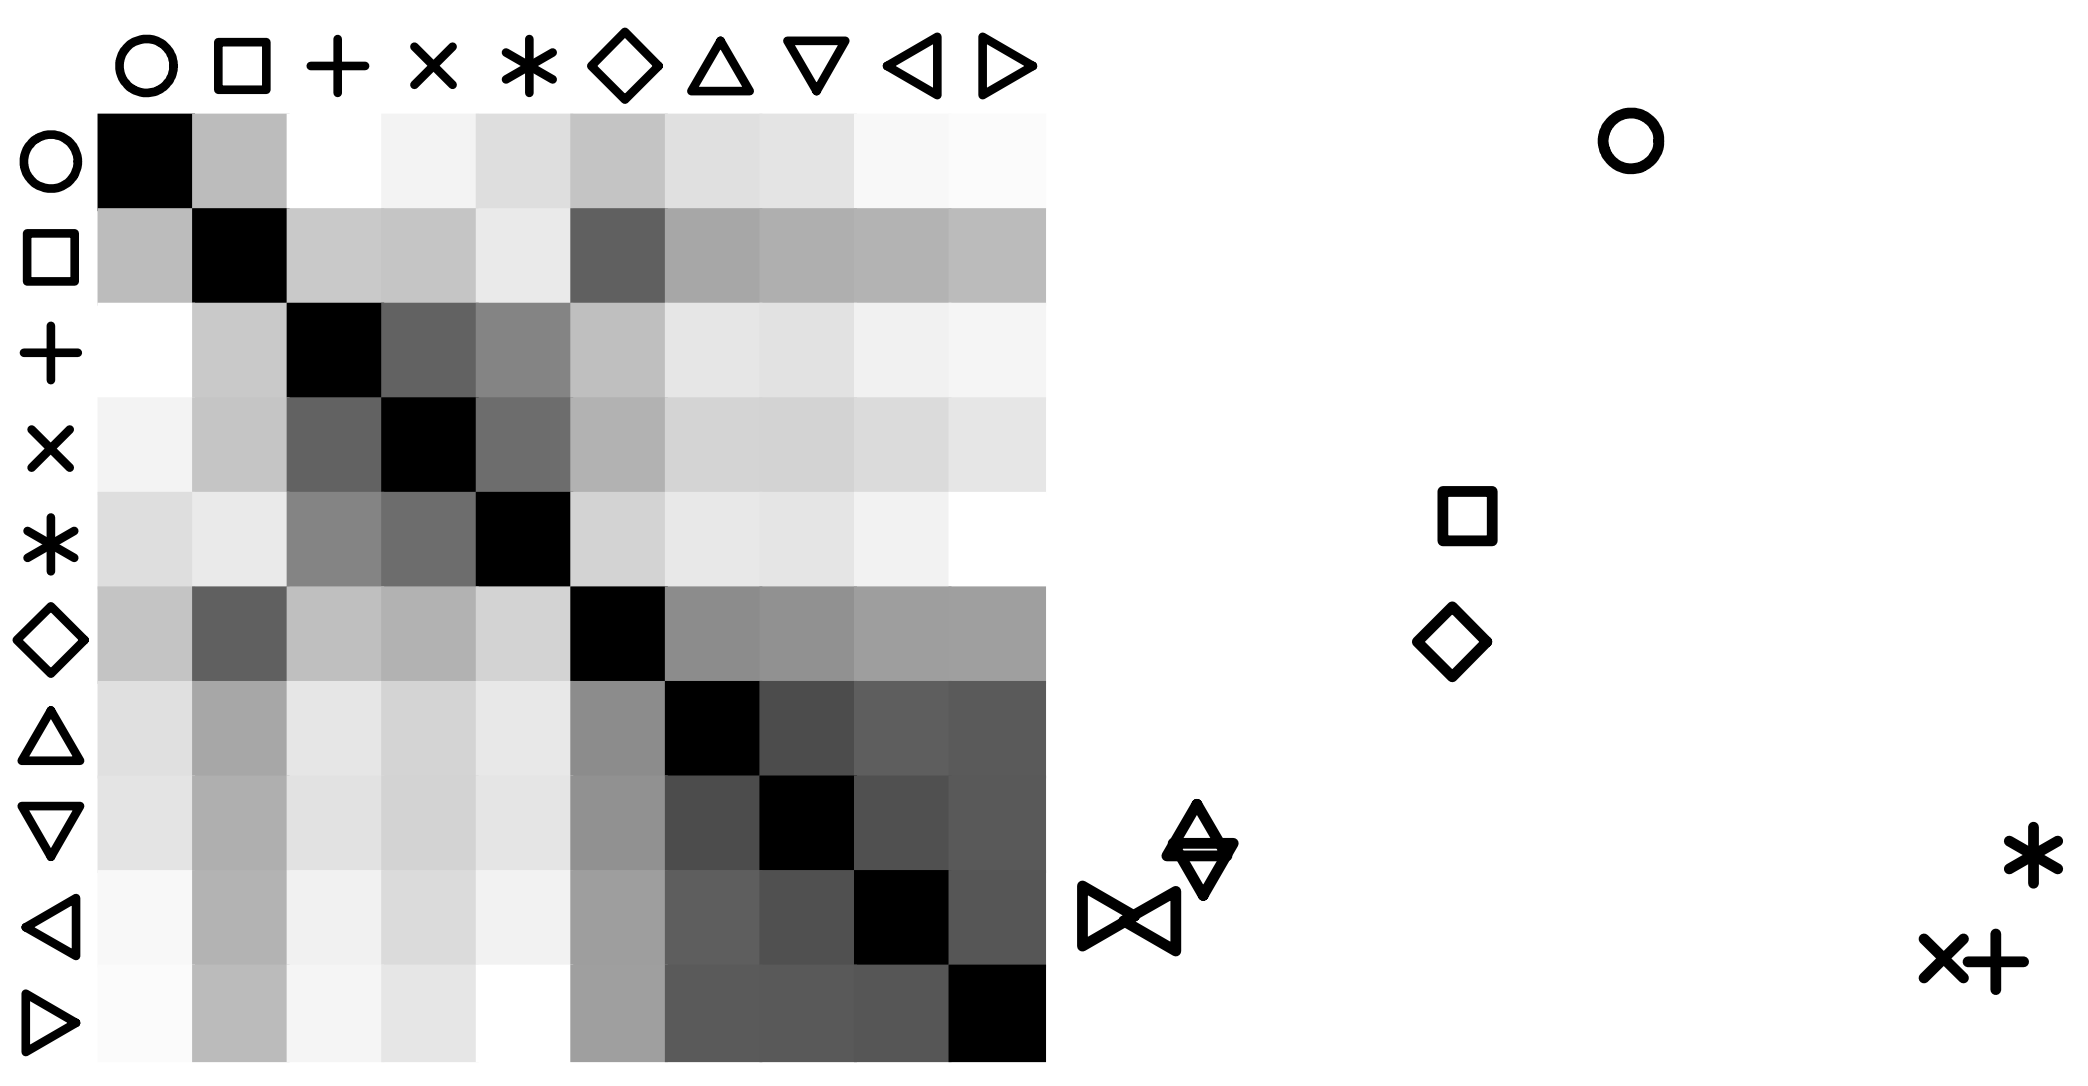
Which shapes play nicely together?
Demiralp et al. (2014), "Learning Perceptual Kernels for Vizualization Design."
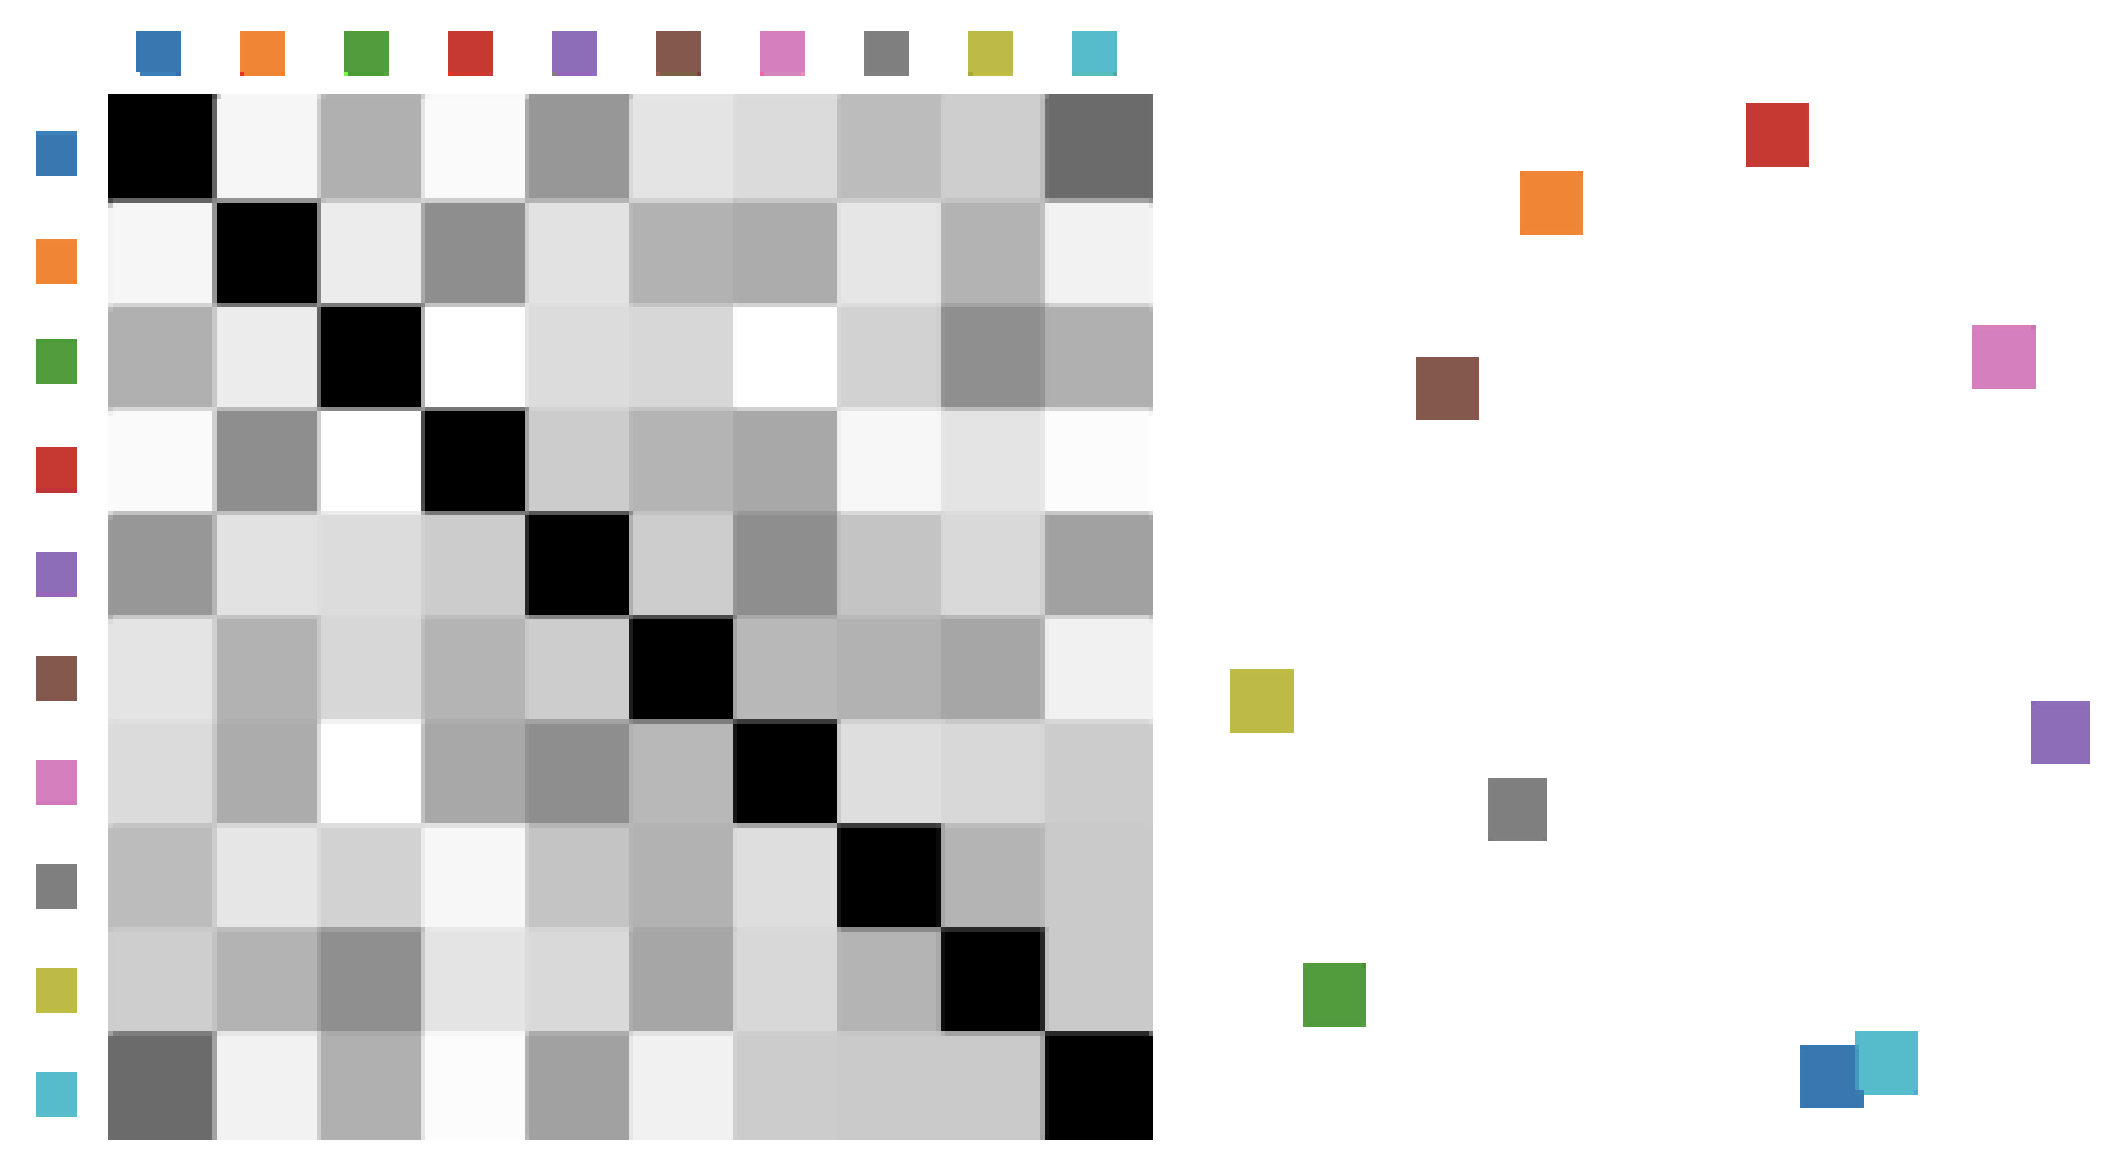
Which colors play nicely together?
Demiralp et al. (2014), "Learning Perceptual Kernels for Vizualization Design."
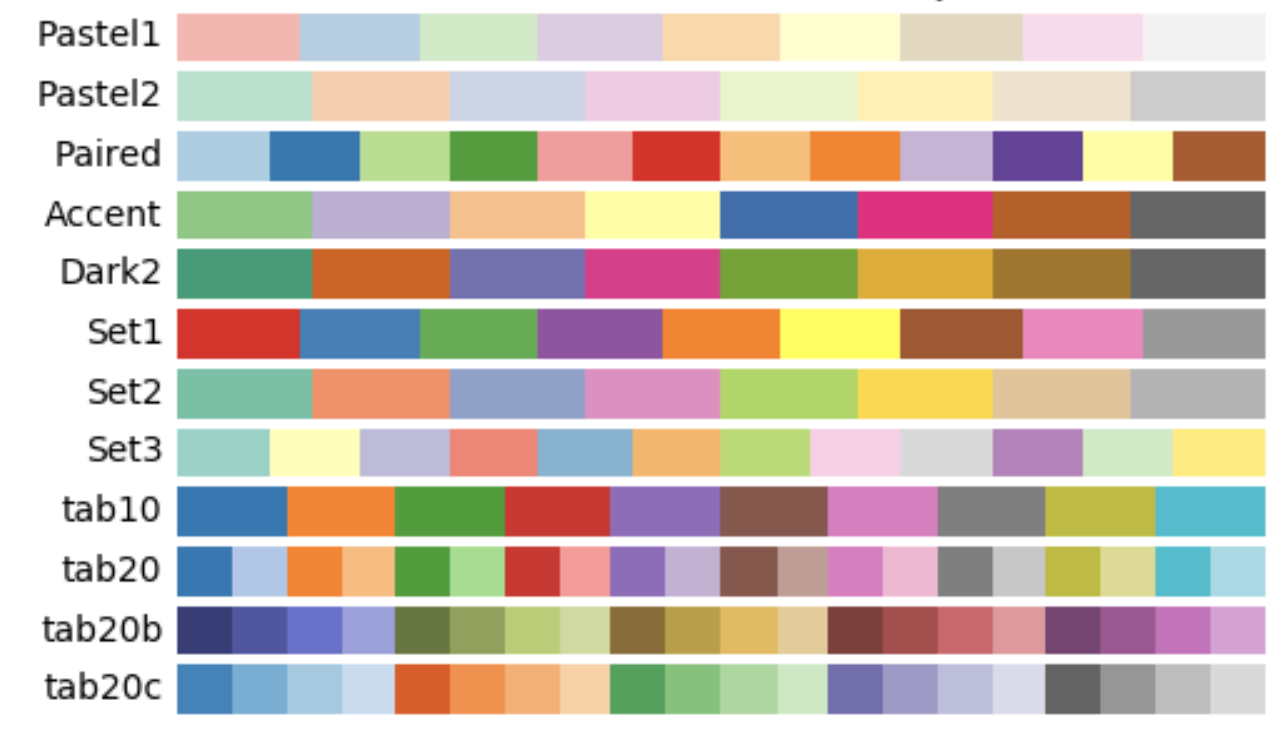
Qualitative Colormaps
Ordered Data
Sequential vs. Diverging
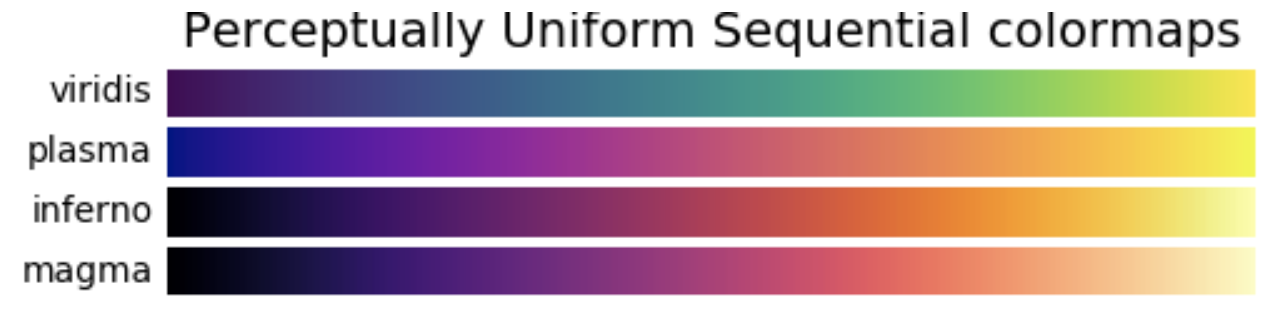
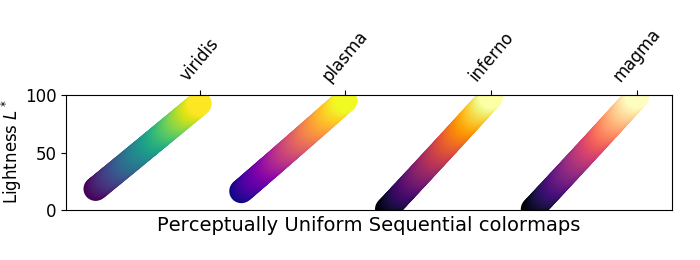
Sequential Colormaps
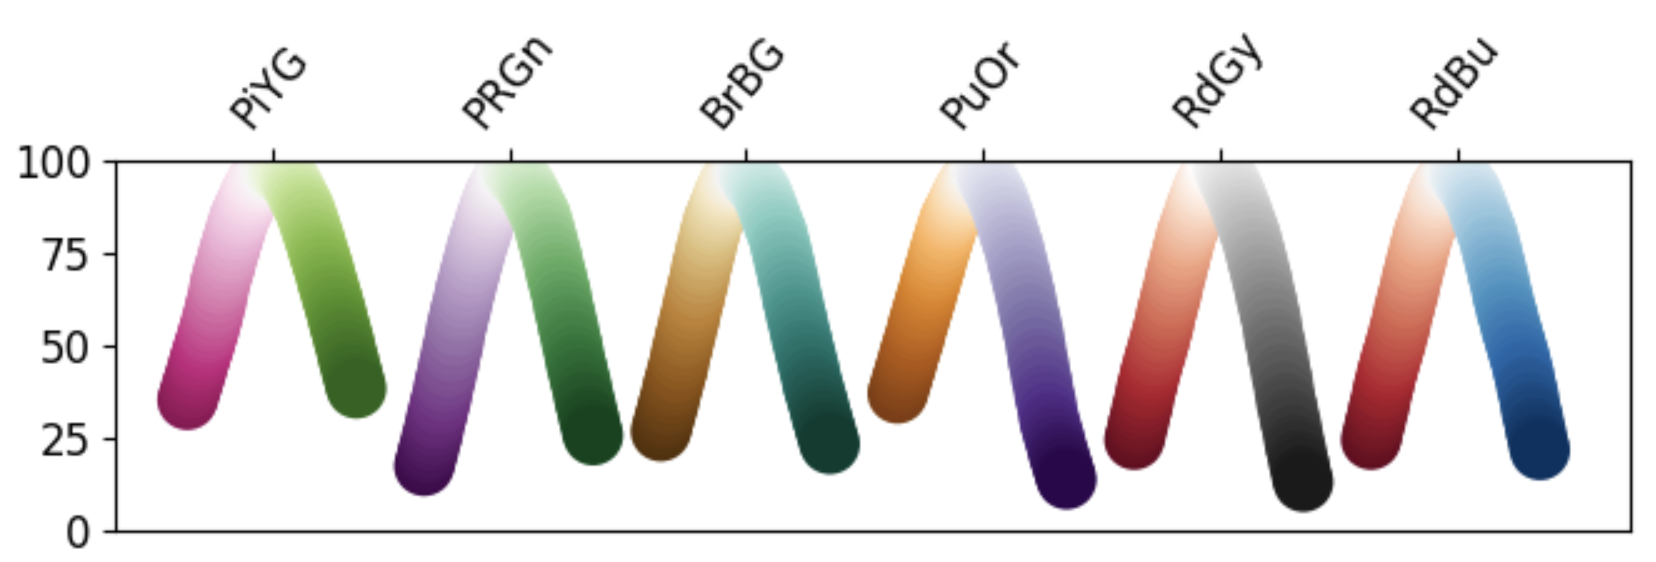
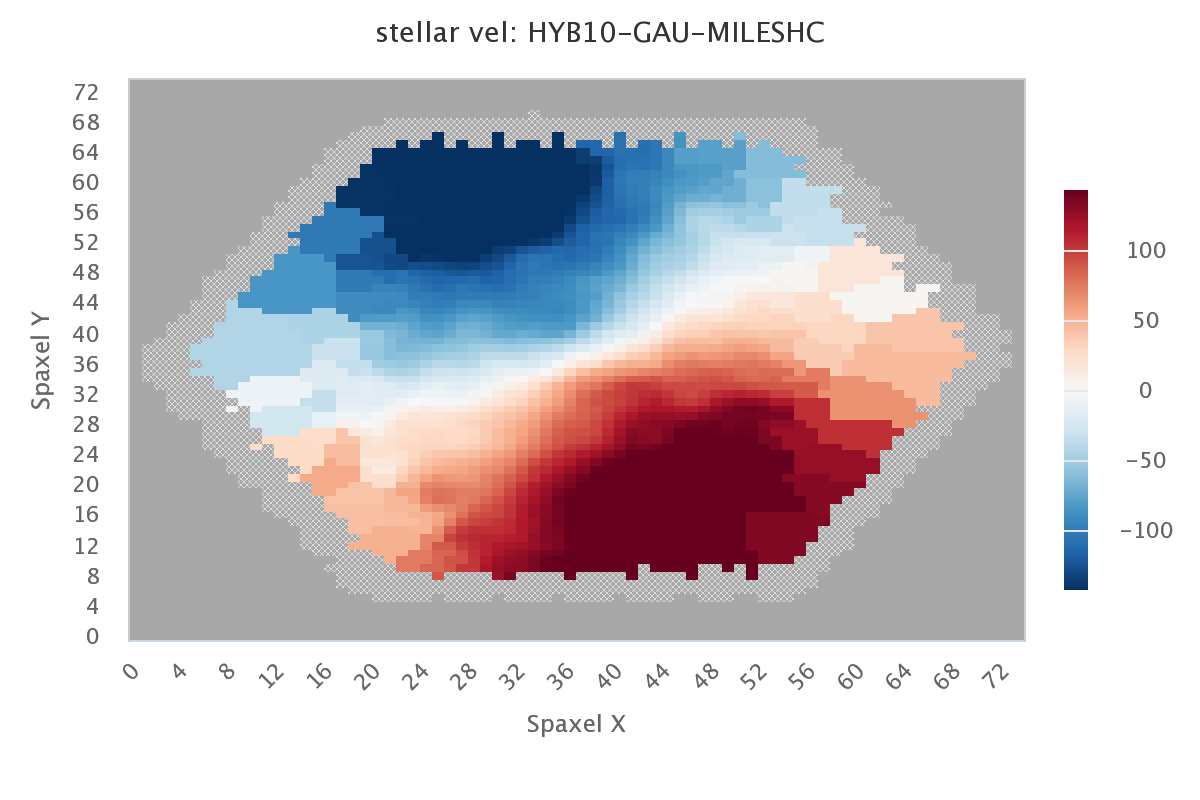
Diverging Colormaps
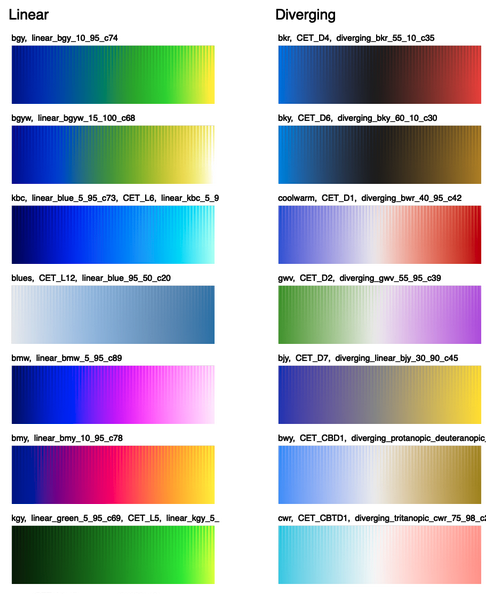
Colorcet: 100+ more colormaps
(with many perceptually uniform).
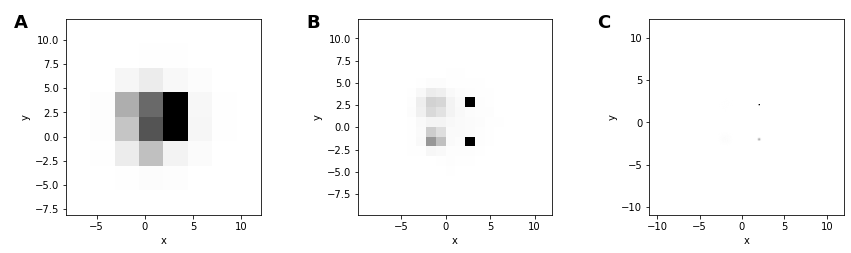
Visualization of big data can be misleading...
...and you might not even realize it.
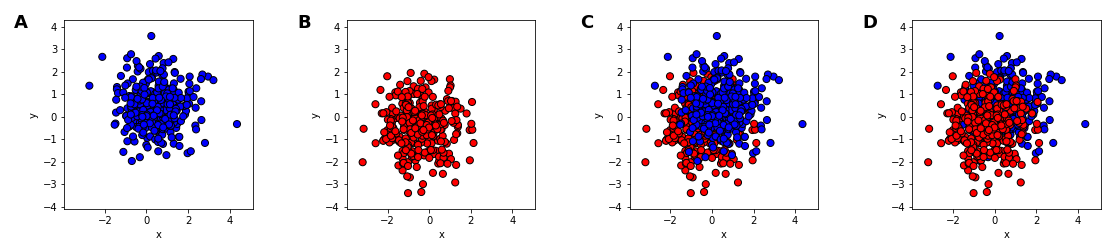
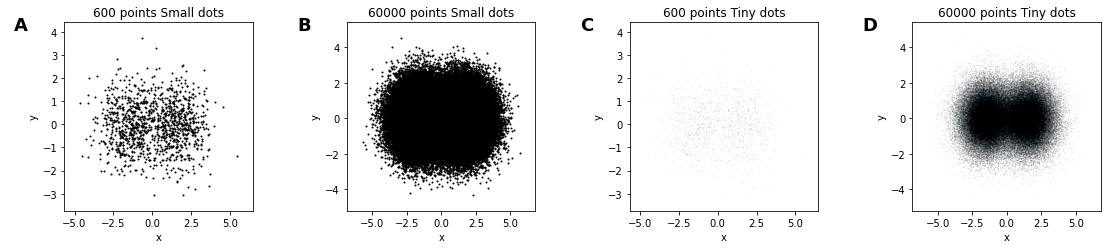
Overplotting
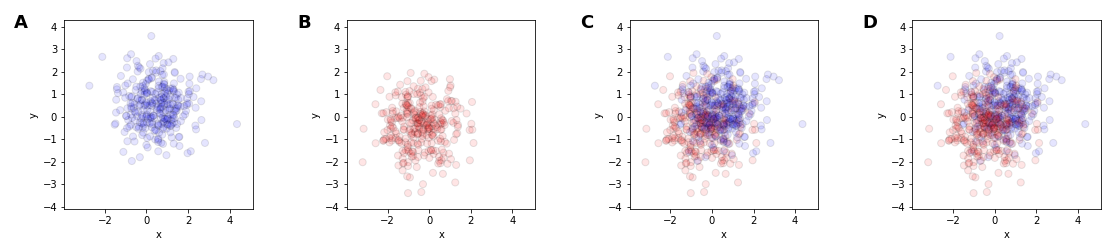
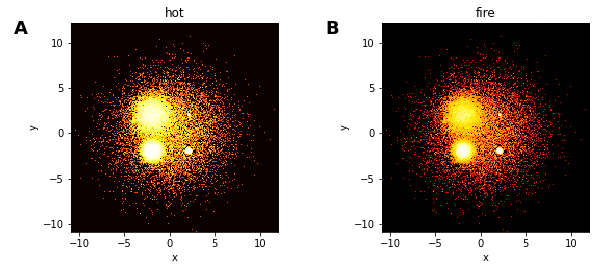
Oversaturation: saturating pixel intensity
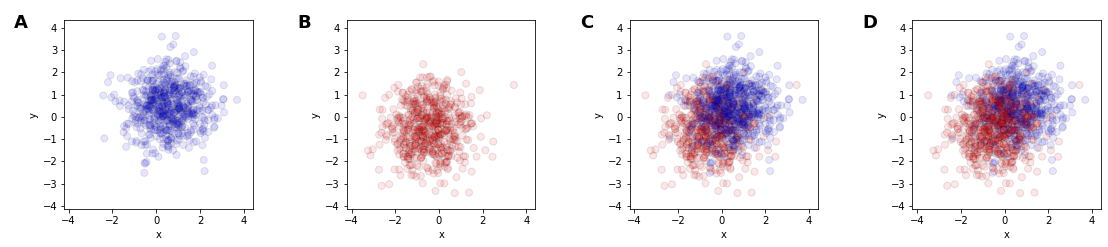
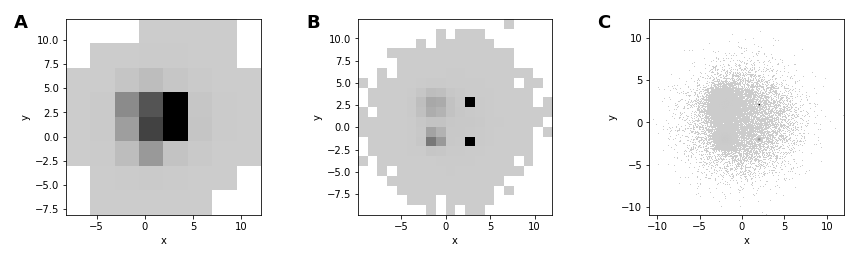
Oversaturation: interpretation depends on data set size and order
Oversaturation: pixel intensity depends on symbol size
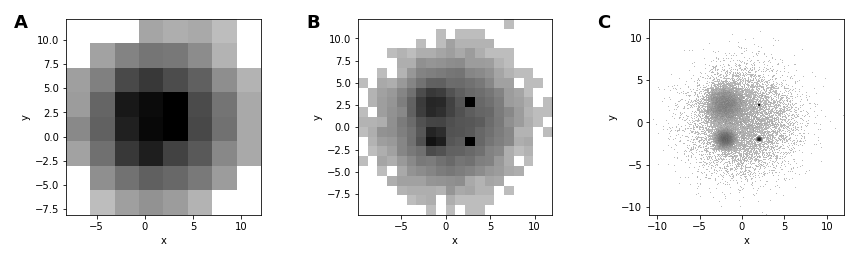
Undersampling: can be difficult to understand full distribution with a subsample
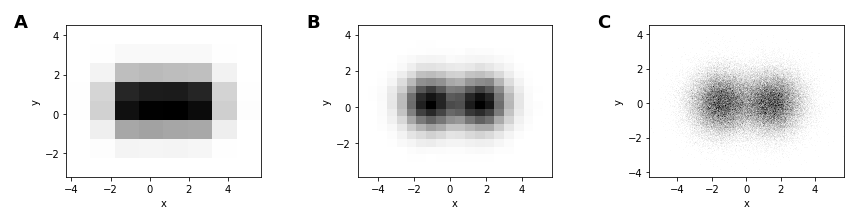
Heatmap: solves overplotting, oversaturation, undersampling
...but need intelligent bin size choice for message
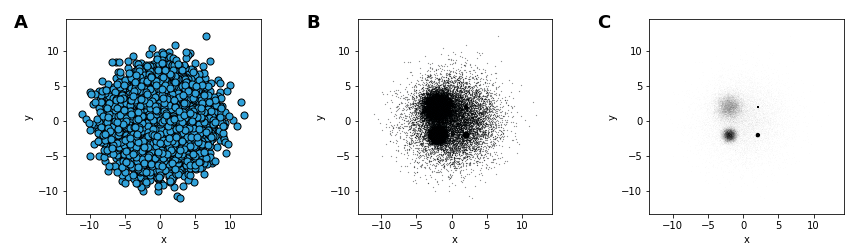
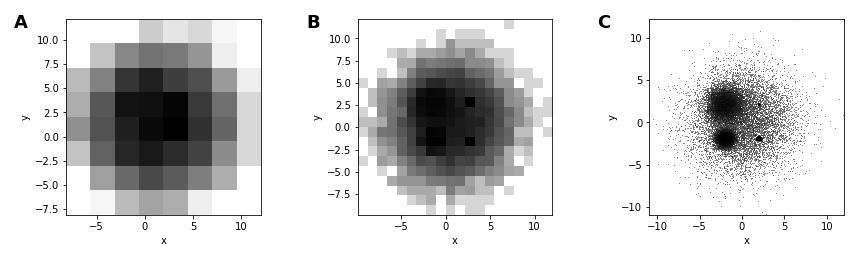
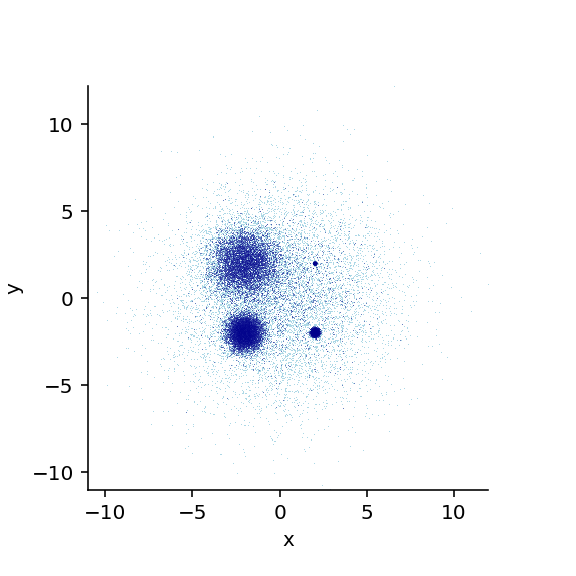
Undersaturation: missing diffuse distributions
Undersaturation: missing diffuse distributions
Undersaturation: offset to make low values visible
Fixing underutilized range: logarithmic transform
Fixing underutilized range: histogram equalization
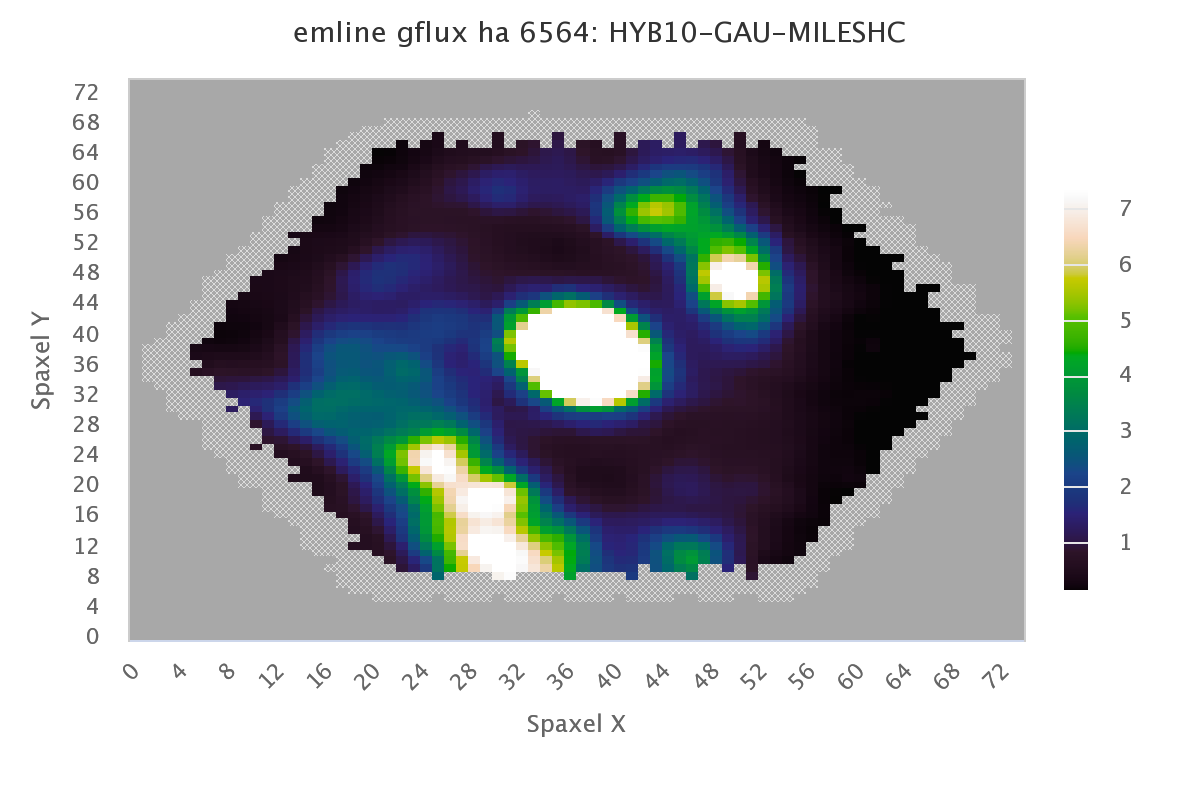
Non-uniform colormap
Datashader: automatically avoid these pitfalls
and quickly plot up to 1 billion points on your laptop
Matplotlib-based option for fast scatter density plots.
Don't make me think!
Take advantage of human perception.